☐ | Fee paid previously with preliminary materials. |
☐ | Fee computed on table |
|
|
|
|
|
|
|
|
|
|
|
|
|
|
|
|
|
|
|
|
|
|


Notice of 20212024
Annual Meeting
of Stockholders
and Proxy Statement
April 20, 202116, 2024
Carey Smith, Chair, President and Chief Executive Officer

Parsons Corporation
5875 Trinity Parkway #300
Centreville, Virginia 20120
To Our Fellow Shareholders:Shareholders
2020 will beImagine next. At Parsons, we create the future of national security and global infrastructure. We examine every element, including future customer needs, macroenvironment trends, technology evolution, and business model innovation to invent what has never been done. For 80 years, that momentum has driven Parsons forward, and we plan for it to fuel our success for the next 80 years.
Managing a transformational linear city driven by 100% renewable energy; applying artificial intelligence (AI) to determine a cyber adversary’s next move; creating innovative means to investigate and remediate emerging contaminants from surface water, groundwater, and soil; countering unmanned air systems; providing air base air defense; protecting critical infrastructure from cyber attacks; applying a commercial as-a-service business model to space command and control—80 years ago, these tasks would have astounded the world. Today, they are what Parsons is doing around the globe every day to imagine next.
Global Trends
We are in an unprecedented time. In national security, the United States is engaged in simultaneous conflicts abroad, preventing the proliferation of weapons of mass destruction, and countering cyberattacks against United States critical infrastructure, while carefully managing near-peer economic, diplomatic, and military ambitions. The US defense budget is projected to grow at a rate of 3% in the upcoming year, none of us will soon forget betweenand there is record investment in the research, development, test, and evaluation budget.
In parallel, the demand for global infrastructure is unprecedented, with shifting priorities, including sustainability, innovative financing, new trends post-COVID, resiliency, and technology application. According to Research and Markets, the global pandemic, politicalinfrastructure sector market is estimated at $2.57 trillion in 2023 and social unrest, widespread cyber-attacks,is projected to reach $3.48 trillion by 2028, for a compound annual growth rate of 6.27% from 2023 to 2028.
Parsons has the right team and the right portfolio at the right time. We are a solutions integrator that differentiates through advanced technology, including AI, cybersecurity, cloud-enabled solutions, and critical infrastructure protection. We have a unique and complementary portfolio at a time when critical infrastructure is under cyber attack and a company must both understand the domain and have the capabilities to protect it. Our dedicated global team consistently performs, and our status as a destination employer enables strong hiring and retention.
With a macroenvironment aligned to our six core markets of cyber and intelligence, space and missile defense, critical infrastructure protection, transportation, environmental remediation, and urban development, Parsons is able to deliver consistent results year-over-year and quarter-over-quarter for our shareholders. Our more than 18,500 employees are focused on executing our customers’ national security and infrastructure missions at a time when operationally relevant solutions are needed.
2023 Results
During our March 2023 Investor Day, we defined our strategy to move up the solutions integration value chain in our six end markets. Our strategy is working. Total revenue for fiscal year 2023 was $5.4 billion, which was a 30% increase from the prior year and was up 23% on an electionorganic basis. Fiscal year 2023 adjusted EBITDA of $465 million increased 32% from 2022, and adjusted EBITDA margin increased 13 basis points, to 8.5%. Operating cash flow for the full year increased 72%, to $408 million dollars. Ramping up new business wins, delivering on contract growth, and continued strong hiring and retention were key drivers to achieving these outstanding results. As a result of our strong performance, we saw stock price appreciation of 35.6% during the year.
In 2023, we set records for major financial metrics, including industry-leading organic revenue growth in both our Federal Solutions and Critical Infrastructure segments, total revenue growth, adjusted EBITDA which also grew faster than revenue, and all-time highs for cash flow and contract awards. These are the best results Parsons has delivered since our initial public offering.
Significant Accomplishments
– M&A: We completed three strategic acquisitions in 2023, two in our Critical Infrastructure segment and one in our Federal Solutions segment. Each brings enhanced and complementary capabilities to Parsons with immediate synergies.
– Win Rates: Parsons had record win rates, at 66% overall. The recompete win rate was unique to say the least. Our hearts go out to those who have suffered,93%, and we all look forwardhave now won four of our major recompetes, each valued at ~$2 billion, by securing the Federal Aviation Administration Technical Support Services Contract in 2023.
– Won 15 programs > $100 million,including the largest new business contracts we have ever won in both segments. Representative wins include the following:
Parsons had an outstanding 2020single-award classified contract for new and continued work in spitesupport of these events. Our strategythe US government
– Book-to-bill: We accomplished a trailing 12-month book-to-bill of 1.1x, and deliver on our customers’ missions.
For the year, we achieved record profitability and cash flow, acquired Braxton Science and Technology Group, and won large contracts.Critical Infrastructure segment had 13 consecutive quarters of > 1.0x book-to-bill. In addition to our $8.6 billion backlog, we have $14 billion in contracts that have been awarded but not yet booked.
– Recognition: We were recognized for our ethicsperformance, including placing as one of Engineering News-Record’s top three companies in four categories: program management, construction management, professional services, and IT leadership,program/construction for fee. We received the Development Project of the Year award for the Lusail City Residential Project in Qatar. Parsons EMEA was also recognized by both Dubai Municipality and ROSHN for exemplary consultancy and design services. The Office of the Director of National Intelligence gave us the National Intelligence Collection Award. The Department of Defense recognized us with our fourth mentor-protégé Nunn-Perry Award.
– Blue Grass/Pueblo chemical weapons elimination: Parsons was part of the team that helped the United States comply with the 1997 Chemical Weapons Convention agreement by destroying our country’s last chemical weapon.
– Achieved AS9100 certification: This is a testament to our aerospace quality management system.
– Delivered first Recovery of Airbase Denied by Ordnance (RADBO) system: Parsons delivered our first RADBO system, which included the first ground-based directed energy weapon system to be approved for production, to the Air Force.
Vision And Investment Thesis
Our vision is to move up the value chain as a solutions integrator that differentiates through advanced technology and to prime and win larger, more profitable contracts. Our mission is to deliver digitally enabled solutions in an operationally relevant time for our defense, intelligence, and infrastructure customers.
So, what makes Parsons different and why are we well as our employee-friendly practices. I am proudpositioned for the future?
– We have an experienced management team that delivers on commitments.
– Our people-first culture and mission focus attracts destination employees.
– All six of our employees’ performanceend markets are growing, enduring, and the way they represent Parsons.
We ended 2020profitable, each with estimated compound annual revenue within 1% of guidance, net income of nearly $100 million, and records for adjusted EBITDA, adjusted EBITDA margin, and cash flow (See “Company Performance Highlights” for a definition of adjusted EBITDA). We delivered net income margin of 2.5% and expanded adjusted EBITDA margins by 180 basis pointsgrowth rates over the past two years.next three years between 5% and 12%.
– We also exceededhave a distinguished national security portfolio positioned to deliver solutions that outpace near-peer threats.
– There is unprecedented global infrastructure spend, including $1.5 trillion in MEA, $1.2 trillion in the high end of our cash flow guidanceUS, and maintained our healthy$140 billion in Canada expected in the future.
– We have a favorable financial outlook and proven, effective capital deployment strategy. We have a strong balance sheet.
However, we were not completely immune fromsheet, and at the items mentioned in my opening paragraph. In terms of revenue, we were less than one percentage point below the low end of our 2020 guidance range and would have exceeded the high end of the range were it not for approximately $200 million of contract work deferredyear had low debt, enabling further acquisitions as a result of the COVID-19 pandemic.we enter 2024.
In terms of other key metrics, we maintained our solid backlog, which stands at two times our 2020 annual revenue, and our new contract bookings were 7% above our annual revenue, a strong indicator of future growth. In addition, we won large new contracts in both operating segments, which was driven by our investments in our technology, people, and recent acquisitions.Responsible Corporation
Key contract wins in 2020 included:
$1.2 billion Valley Line West Light Rail Transit project for the City of Edmonton, in Alberta, Canada
$224 million extension to the Riyadh Metro project, which is the largest ongoing metro project in the world
$307 million and $180 million contracts for classified work with classified customers
$51 million contract employing Parsons’ ZEUS™ directed-energy system, which can target at more than 300 meters and has enough power to detonate cluster bombs, land mines, and general-purpose bombs. This is the first DoD ground-based laser system placed into production.
Successfully Executing Acquisition Strategy While Maintaining Strong Balance Sheet
Late in the year, we acquired Braxton, which reinforces our position in the rapidly expanding space market and underscores our disciplined approach to M&A. We strive to acquire companies that operate in specific high-priority and high-growth markets. We also like to acquire companies that we’ve worked with in the past, that have a strong reputation in the market, and that benefit from our scale and broader set of capabilities. Braxton perfectly aligns with this aspect of our M&A strategy. In addition, we ensure our M&A candidate companies have great technology, exceptional management teams, and are a strong fit with our agile and innovative culture. Braxton also meets these objectives.
Braxton exceeded all of our major financial criteria, as well, with revenue growth and adjusted EBITDA margins above 10%, and is accretive. Braxton enhances our margin and revenue growth profile and further strengthens our strategy to win large prime contracts within the DoD and intelligence communities.
Our disciplined M&A approach and robust cash flow enabled us to maintain our strong balance sheet. We generated cash flow of $289 million for the year and ended 2020 with a net leverage ratio of approximately 0.3x. Our low leverage and over $500 million of undrawn revolver capacity, will enable us to continue to make strategic investments in accretive acquisitions, R&D, our people, and our culture.
Doing the Right Thing
In addition to successfully executing on our strategy, Parsons has an 80-year history of cultivating a longstanding commitment to integrity, diversity and inclusion, and doing the right thing. These are two ofresponsible enterprise. Driven by our core values, as an organization. We are a smarterParsons has long been recognized for excellence in corporate citizenship. 2023 continued that legacy of recognitions and stronger company when we all work together. Attention to environment, social, and governance (ESG) excellence remains a critical component of our culture and ability to drive shareholder value. In 2020, we took steps to elevate our ESG work, which began at the Board level. The Corporate Governance and Responsibility Committee took on the additional oversight of economic, environmental, and social topics and was renamed the Corporate Governance and Responsibility Committee. We felt this was an important step to reinforce our commitment to delivering a better world.
We also have a culture of continuous improvement, which includes revisingadvancing sustainability, equity, and updating our Code of Conduct and human rights policies, modifying and streamlining our supplier diversity process, extending our sustainability practices, and supporting our employees and their well-being.engagement. In addition, we have invested in our communities through our employee-driven2023, Parsons Gives Back program. Even with the limitations of a global pandemic, our teams rose to the challenge and found new and innovative ways to give back to communities, including blood donations, support for schools going online, clean-up efforts, homeless outreach and food donations, and supporting US military veterans and their families, just to name a few.
We are also proud of the various awards and recognition we received in 2020, including:
Ethisphere Institute recognition in 2020 aswas named one of the World’s Most Ethical Companies by Ethisphere for the eleventh14th consecutive year, reinforcing the critical importance of ethics and integrity in driving our culture of performance. That success is built on our active participation in the communities where we live and work, supporting organizations like the Tragedy Assistance Program for Survivors (TAPS), where we have raised $1.3 million in support of military families in the 16 years of our partnership; in 100 employees volunteering a total of 450 hours to support global technology education nonprofit Technovation in its efforts to advance women in STEM; and in a rowglobal back-to-school fundraiser where we supported 1,300 students in communities where we work with school supplies, meals, and uniforms. In total, Parsons employees logged more than 35,000 volunteer hours in 2023, a company record which illustrates our commitment to being a responsible partner.
In 2023 we announced our commitment to set near- and long-term targets for Greenhouse Gas (GHG) emissions aligned with 1.5C and net-zero through the Business Ambition for 1.5C campaign, a leading global coalition committed to taking urgent climate action.
Our initiatives have been recognized by leading organizations, including the following:
Forbes recognition as oneBest of the World’s Best Employers
A perfect score of 100 on the Human Rights Campaign Foundation Corporate Equality Index for active support and inclusion of the LGBTQ+ community
Honored by the Virginia DepartmentThe Future
In a world of uncertainty and change, our strategy for the Blindfuture remains constant and Vision Impaired for excellencefocused on continuing to move up the value chain in access for disabled persons
Named a Best for Vets Employer – 2020 by Military Times, as one of the country's best employersour six well-funded and organizations with military-connected employment programs, benefits,growing core end markets. Our expertise in innovative technologies, our mission-focused ethos, and support efforts
Namedour commitment to the CIO 100 list of the world's most innovative companies
Looking Forward
2020 was another successful year, producing record results for adjusted EBITDA, margins, and cash flow in spite of headwinds, primarily from COVID. We also successfully delivered onsolving our customers’ critical missionstoughest challenges, as outlined in our strategy, are the foundation for our future. While no one can predict the future, we can certainly imagine next and executed our growth strategy, while maintainingknow that digital technology, particularly AI and cyber, will play a strong balance sheet to support additional investments in organic growth and acquisitions. We are excited about our future and confident our diversified portfolio is aligned with the Biden Administration’s priorities for national defense, infrastructure, and environmental initiatives. significant role.
In closing, I want to thank the employees of Parsons Corporation for delivering results for our customers and shareholders in 2023. It is our mission plus our unique culture that engage and excite our employees shareholdersto imagine next.
Carey Smith
Chair, President, and customers for their continued loyalty and dedication. Without your support, we could not have achieved our goals, and together we will continue to drive future shareholder value as we collectively deliver a better world. CEO
/s/ Charles H. Harrington
Charles H. Harrington
Chairman/CEO

NOTICE OF PARSON’SPARSONS CORPORATION 20212023 ANNUAL MEETING OF STOCKHOLDERS
Time and Date: | 9:00 a.m. (EDT), April | |
Place: | Virtual Meeting accessible via: www.virtualshareholdermeeting.com/ | |
Agenda: | 1. The election of four director nominees named in the proxy statement; | |
2. The ratification of the selection of PricewaterhouseCoopers LLP as the Company’s independent registered public accounting firm for the Company’s fiscal year | ||
3. A non-binding advisory vote on the compensation program for the Company’s named executive officers, as disclosed in the Compensation Discussion and Analysis section of the proxy statement; and | ||
4. The transaction of any business that may be properly brought before the annual meeting. | ||
The Board of Directors recommends that you vote FOR Proposals 1, 2, and 3. | ||
Record Date: | Only holders of record of the Company’s common stock on February | |
Date of Distribution: | This proxy statement and the accompanying materials are being mailed to stockholders on or about March | |
Proxy Voting: | Your vote is important. Whether or not you plan to attend the annual meeting, you may access electronic voting via the Internet or the automated telephone voting feature, both of which are described on your enclosed proxy card, or you may sign, date, and return the proxy card in the envelope provided. If you plan to attend the annual meeting, you may vote in person. | |
On Behalf of the Board of Directors,
/s/ Michael R. Kolloway
Michael R. Kolloway
Chief Legal Officer and Secretary
March 10, 20213, 2024
Important Notice Regarding the Availability of Proxy Materials for the Annual Meeting of Stockholders to be held on April 20, 2021:16, 2024. This Notice of Annual Meeting and Proxy Statement and our 20202023 Annual Report are available at www.parsons.com.
TABLE OF CONTENTS TOTO PROXY STATEMENT
1 | ||||
| ||||
| ||||
| ||||
| ||||
| ||||
CORPORATE GOVERNANCE AND GENERAL INFORMATION CONCERNING THE BOARD OF DIRECTORS AND ITS COMMITTEES |
| |||
| ||||
| ||||
| ||||
| ||||
| ||||
15 | ||||
| ||||
| ||||
| ||||
18 | ||||
18 | ||||
| ||||
| ||||
| ||||
| ||||
| ||||
COMPENSATION AND MANAGEMENT DEVELOPMENT COMMITTEE INTERLOCKS AND INSIDER PARTICIPATION |
| |||
| ||||
| ||||
| ||||
| ||||
| ||||
| ||||
| ||||
Indemnification Agreements and Directors’ and Officers’ Liability Insurance |
| |||
| ||||
i
26 | ||||
| ||||
| ||||
| ||||
i
74 | ||||
ii
| ||||||
IMPORTANT INFORMATION ABOUT ANNUAL MEETING AND PROXY PROCEDURES |
| |||||
A-1 |
| |||||
ii
iii
This summary highlights certain information contained elsewhere in this proxy statement. The summary does not contain all of the information that you should consider, and you should review our Annual Report on Form 10-K for the year ended December 31, 20202023 and the entire proxy statement carefully before voting.
Unless the context otherwise requires, (i) the terms “Parsons,” “the Company,” “we,” “us” and “our” refer to Parsons Corporation and its consolidated subsidiaries, (ii) “our Board” or “the Board” means the Board of Directors of the Company; (iii) “stockholder” means holders of our common stock; and (iv) “you,” “your,” “yours,” or other words of similar import in this proxy statement refers to stockholders entitled to vote on the matters to be presented at the annual meeting.
20212024 Annual Meeting of Stockholders
Date and Time: | April | |
Place: | Virtual Meeting (www.virtualshareholdermeeting.com/ | |
Record date: | February | |
Admission: | Annual meeting admission is limited to our registered and beneficial stockholders as of the record date and persons holding valid proxies from stockholders. Admission to our annual meeting requires proof of your stock ownership as of the record date, and valid, government-issued identification. See “Important Information about Annual Meeting and Proxy Procedures” in this proxy for additional information. | |
Voting Matters and Board Recommendations
Stockholders are being asked to vote on the following matters at the 20212024 Annual Meeting of Stockholders:
Proposal | Description | Board’s Voting
| Page |
No. 1 | Election of four | FOR each nominee |
|
No. 2 | Ratification of appointment of PricewaterhouseCoopers LLP (“PwC”) as the Company’s independent registered accounting firm for fiscal year | FOR |
|
No. 3 | A non-binding advisory vote on the compensation program for the Company’s named executive officers, as disclosed in the Compensation Discussion and Analysis (“CD&A”) of the proxy statement | FOR |
|
1
How to Vote
Stockholders as of the record date may vote in person at the meeting or vote in advance by submitting a proxy by Internet, telephone, or mail as follows:
In person by attending the Annual Meeting and following the instructions provided in the Notice;
Via the Internet by following the instructions provided in the Notice;
If you request printed copies of the proxy materials by mail, by filling out the proxy card included with the materials; or
By calling the toll-free number found on the proxy card or the Notice
Company Performance and 20202023 Highlights
We are very proud of our accomplishments in 2020:2023:
Record Revenue of $3.9$5.4 billion which includes $200 million of adverse impact from COVID-19
Net income of approximately $99$161.1 million
AdjustedRecord adjusted earnings before interest, taxes, depreciation and amortization (“EBITDA”) of $343$464.7 million
Adjusted EBITDA margin expanded of 8.7%
CashRecord cash flow from operating activities of $289$408 million
Completed oneAchieved significant Federal Solutions acquisition: Braxton Science & Technology Group
|
Completed the acquisitions of IPKeys Power Partners, Inc. and I.S. Engineers LLC to enhance our capabilities in critical infrastructure protection and transportation engineering and to position the company for projects receiving transportation funding under the Infrastructure Investment and Jobs Act between 2024 and 2026
Moved 90% of our workforce to safely and efficiently serve our customers
We calculate adjusted EBITDA as net income attributable to Parsons Corporation, adjusted to include net income attributable to noncontrolling interests and to exclude interest expense (net of interest income), provision for income taxes, depreciation and amortization and certain other items that we do not consider in our evaluation of ongoing operating performance. These other items include, among other things, impairment of goodwill, intangible and other assets, interest and other expenses recognized on litigation matters, amortization of deferred gain resulting from sale-leaseback transactions, expenses incurred in connection with acquisitions and other non-recurring transaction costs, equity-based compensation, and expenses related to our corporate
2
restructuring initiatives. EBITDA and adjusted EBITDA are non-GAAP metrics, and we include a reconciliation of both EBITDA and adjusted EBITDA to net income for fiscal years 20192023 and 20202022 as Appendix A. It is an important component of our compensation programs described in this proxy statement.
Our Board of Directors
This year’s Board nominees include four current Class II Directors—Mark K. Holdsworth, Steven F. Leer, M. Christian Mitchell, and David C. Wajsgras. Each nominee is listed below along with the continuing Directors,and you can find additional information under “Proposal 1: Election of Directors” beginning on page 6.7.
Corporate Governance Highlights
NineIn 2023, nine of our current eleven Directors arewere independent, and the Audit and Risk, Compensation and Management Development, and Corporate Governance and Responsibility Committees are 100% independent.
Our Board of Directors reflects diversity in gender, (three females), ethnicity, experience, qualifications, attributes, and skills.
The Board undertakes an annual evaluation of its performance, and each Committee of the Board undertakes an annual evaluation of the Committee’s performance and of the adequacy of its charter.
The Board of Directors holds regular executive sessions of non-management Directors.
The Board of Directors conducts an annual discussion on management and level 2 leadership succession planning.
Our investor relations team and management teams regularly engage with current and potential investors.
Note: Mark Van Andel to update In 2023, Parsons has implemented executive officerelected to disclose information related to our climate-related governance, risk management and director stock ownership guidelines.
AdditionThe Charter of responsibilities forthe Compensation and Management Development Committee was amended to confirm the Committee’s ability to claw back executive compensation in conformance with the Dood-Frank Act.
3
Executive Compensation Highlights
Together with our Compensation and Management Development Committee, we are committed to designingmanaging a compensation program that is competitive and aligns the interests of our executives with the long-term interests of our stockholders. We continuously seek to evolve our approach and stay connected with the views of our stockholders.
Our executive compensation programs and policies are intendedhave been designed to support the development and performance of a strong executive team who are provided with appropriate incentives that supportalign with our business strategy and values, buildattract and retain top talent and address different risks associated with compensation. We strive to provide a total compensation package that fairly and equitably rewards our senior leadership as a team and as individuals, from each of whomwhich we expect superior performance.
We have designed our executive pay programs to reward executives for positive company performance and align their interests with those of our stockholders by having a significant portion of compensation composed of performance-based or “at-risk” compensation. We
provide an appropriate balance of short- and long-term compensation, with payouts based on the Company’s achievement of certain objective financial and non-financial metrics. We have structured our short-term incentive opportunities to focus on the achievement of specific annual financial objectives that will further our longer-term growth objectives. We use our long-term incentive compensation to provide incentives for our executive team to focus on the growth of our overall enterprise value and, correspondingly, to create value for our employee stockholders.
|
In designing and implementing our executive compensation programs, we follow practices that promote goodproper governance and serve the interests of our stockholders, with maximum payout caps in place for annual cash incentives and long-term performance awards.
For more details on our compensation program, please see our discussion in the CD&A section of this proxy.
Corporate Citizenship Highlights
We are committedImagine Next extends to beingour commitment to imagining what’s next for the communities where we live and work. Driven by our core values – safety, quality, innovation, sustainability, integrity, and diversity – and underpinned by our CARE (Cultivating a good corporate citizen with an Environment, Social and Governance (“ESG”) ethos focused on our corporate quest to Deliver a Better World through disruptive technology solutions. We take great pride in our human capital management, including building a diverse work environment, supporting lifelong employee learning, and contributing to charitable and community causes through Responsible Enterprise) strategy,our Parsons Gives Back Program. program outlines our active charitable and engagement support to communities and organizations towards imagining a safer, healthier, more connected, and more secure world.
4
Our Parsons Gives Back efforts are employee drivenemployee-driven and focused on veteran/military, Educational/STEM Outreach, and Vibrant Communities causes. The Corporate Governance and ResponsibilityCG&R Committee of the Board oversees Parsons Corporation’s ESG efforts and receives regular reports from the Chief Corporate Affairs Officer.Business Operations Officer and ESG vice president.
Recognitions and initiatives include:
|
We were recognized by the |
The Defense Department recognized Parsons (Polaris Alpha®) with the James S. Cogswell Industrial Security Achievement Award, which honors outstanding participation and compliance with the National Industrial Security Program.
Our 2020 Corporate Social Responsibility Report titled “Believe in Better” transparently documents our ESG efforts underpinned by our core values of Safety, Quality, Integrity, Diversity, Innovation, and Sustainability. Our ESG website at parsons.com/care, “Cultivating a Responsible Enterprise”, provides a comprehensive description of our enterprise wide ESG strategy and efforts.
We received Nunn-Perry award, recognizing outstanding achievement in the Department of Defense (DoD) Mentor-Protégé Program, for our mentor-protégé agreement with a woman-owned, service-disabled veteran owned small business and Alabama State University.
Members of our IT team participated in a virtual coding marathon, 48 in 48. They had 48 hours to create a 10-page website for a non-profit organization. The Parsons’ team was matched with the Chicago Tap Theater, a non-profit dance theater that highlights the rich history and inclusivity of tap dance and offers classes to children who are deaf or hard of hearing.
|
|
2020 Annual Top 50 Employers List in STEM Workforce Diversity Magazine (5 years)
Employer Support of the Guard and Reserve (ESGR) Recognition
Annual Top 50 Employer Minority Engineer Magazine (8 years)
Annual Top 50 Employers Woman Engineer Magazine (2 years)
|
|
Forbes has recognized Parsons Corporation as one of the World’s Most Ethical Companies for the 14th consecutive year. The World’s Most Ethical (WME) Companies assessment is based upon the Ethisphere Institute’s Ethics Quotient (EQ) framework, which offers a quantitative way to assess a company’s performance in an objective,consistent and standardized manner. Scores are generated in five key categories: ethics and compliance program,culture of ethics,corporate citizenship and responsibility, governance and leadership, and reputation.
Our commitment to enhancing diversity, equity and inclusion as fundamental to our corporate culture is evident through our support of active duty and veteran employees (MILVET), employees in the LGTBQ+ community (PRIDE Alliance), employees of African/American heritage (BELONG),employees of Hispanic/Latino heritage (HOLA), Parsons’Women’s Roundtable (PWR), and employees of Asian and Pacific Islander heritage (SOAR), and their allies. Parsons also launched its seventh employee resource group, the Formation of Rising Career Employees (FORCE), designed to provide a supportive community for employees who are in the early stages of their careers at Parsons.
5
Other notable recognitions include:
•
6
PROPOSAL 1: ELECTIONELECTION OF DIRECTORS
Our Board of Directors currently consists of eleven members. In accordance with our certificate of incorporation, our Board of Directors are divided into three classes with staggered three-year terms. At each annual meeting of stockholders after the initial classification, the successors to the Directors whose terms will then expire will be elected to serve from the time of election and qualification until the third annual meeting following their election. Our current Directors are divided among the three classes as follows:
The Class I Directors are Letitia A. Long, James F. McGovern, Harry T. McMahon and Carey A. Smith, and their terms will expire at the 2026 annual meeting of stockholders in 2023; provided, that Mr. McGovern’s term will end at the 2022 annual meeting of stockholders due to his reaching the corporation’s mandatory retirement age;
The Class II Directors are Mark K. Holdsworth, Steven F. Leer, M. Christian Mitchell, and David C. Wajsgras, and their terms will expire at the 2021annual meeting of stockholders to be held on April 16, 2024. Directors Holdsworth, Leer, Mitchell, and Wajsgras are seeking re-election at the 2024 annual meeting of stockholders; and
The Class III Directors are CharlesGeorge L. Harrington, GeneralBall, Ellen M. Lord, Darren W. McDew, (USAF, Ret.) and Major General Suzanne M. Vautrinot, USAF (ret), and their terms will expire at the 2025 annual meeting of stockholders to be held in 2022.
Any increase or decrease in the number of Directors will be distributed among the three classes so that, as nearly as possible, each class will consist of one-third of the Directors. This classification of our Board of Directors may have the effect of delaying or preventing changes in control of our company.
The four nominees for election as Class II Directors are listed below. If elected, the nominees for election as Class II Directors will serve for a term of three years and until their successors are elected and qualify. Unless you instruct us on the proxy card to vote differently, we will vote signed, returned proxies FOR the election of such nominees. If for any reason any nominee cannot or will not serve as a Director, we may vote such proxies for the election of a substitute nominee designated by the Board.
To be elected in, a nominee must receive a plurality of the votes cast. The Corporate Governance and Responsibility Committee and the Board believe that each Class III Nominee brings a strong and diverse set of skills and experiences to the Company, including significant government, public company, financial, and strategic experience, that strengthen our Board’s independent leadership and effectiveness with respect to our business and long-term strategy. The Class II Nominees are as follows:
7
Mark K. Holdsworth (Class II)
Age: Director Since: 2006
• Corporate Governance & Responsibility • Compensation &
| Mark K. |


Steven F. Leer (Class II)
Age: Director Since: 2013
• Audit and Risk • Compensation & Management Development |
| Steven F. Board Skills Matrix set forth in this Proxy Statement. |


8
M. Christian Mitchell (Class II)
Age: Director Since: 2011
• Audit and Risk • Corporate Governance & Responsibility |
| M. Christian Mitchell |


David C. Wajsgras (Class II)
Age: Director Since: 2020
• Audit and Risk • Compensation & Management Development |
| David C. Wajsgras |


The Board of Directors recommends a vote FOR each of the Class II nominees. |
9
CONTINUING DIRECTORS
The seven Directors whose terms will continue after the annual meeting and will expire at the 20222025 annual meeting (Class III) or the 20232026 annual meeting (Class I)II) are listed below.
(Class III)
Age: Director Since:
|
|


Ellen M. Lord (Class III)
Age: 64 Director Since: 2022 Committees: • Compensation & Management Development • Corporate Governance & Responsibility | Ellen M. Lord served as the Under Secretary of Defense for Acquisition and Sustainment for the industrial industries. |

10

Gen Darren W. McDew
(Class III)
Age: Director Since: 2020 Committees: • Corporate Governance & Responsibility • Compensation & Management Development |
| Gen. Darren W. McDew (USAF, Ret.) served |


|
|


|
|

Major General Suzanne M. (Class III)
Age: Director Since: 2014
• Audit and Risk • Corporate Governance & Responsibility | Major General Suzanne M. “Zan” Vautrinot, (USAF, Ret.) |


11
Letitia A. Long (Class I)
Age: 64 Director Since: 2020 Committees: • Audit and Risk • Corporate Governance & Responsibility | Letitia A. Long currently serves as chairwoman of the board of directors of the Intelligence and National Security Alliance (INSA). Ms. Long previously served as Director of the National Geospatial-Intelligence Agency from 2010-2014 and as Deputy Director of the Defense Intelligence Agency, Deputy Undersecretary of Defense Intelligence (Planning, Policy & Resources), and Deputy Director of Naval Intelligence for the Department of Defense. Ms. Long serves on the board of directors of T-Mobile U.S., and COPT Defense Properties and is a member of the National Geospatial-Intelligence (NGA) Advisory Board. Ms. Long is member of the Virginia Tech Board of Visitors and provides mentoring and advisory work for the government on space and special reconnaissance programs and has remote earth sensing and geospatial intelligence experience. Ms. Long previously served on the board of directors of Raytheon Company, now part of Raytheon Technologies, from 2015 until 2020 and chaired the Public Policy and Corporate Responsibility Committee. Ms. Long was awarded NACD Directorship 100 in 2020 and was elected to the Virginia Tech Academy of Engineering Excellence. She received her bachelor-of-science degree in electrical engineering from Virginia Polytechnic Institute and State University and her master-of-science degree in engineering from The Catholic University of America. | |
Harry T. McMahon (Class I)
Age: 70 Director Since: 2018 Committees: • Audit and Risk • Compensation & Management Development | Harry T. McMahon spent 32 years in investment banking and has broad experience providing strategic and financial solutions for corporations and institutions worldwide. This includes leading teams on mergers and acquisitions and corporate finance advisory projects, many of which involved industries adjacent to Parsons Corporation, such as infrastructure, engineering, aerospace and defense, enterprise technology, and federal services. He previously served as co-head of Global Corporate Finance at Merrill Lynch and then as Executive Vice-Chairman of Bank of America. He currently serves as a director of Direct Relief, a global provider of humanitarian aid, and as a trustee of Claremont McKenna College, where he previously served as chairman of the board. He earned a bachelor-of-arts degree and honorary doctorate from Claremont McKenna College and a master-of-business administration from the University of Chicago Booth School of Business. | |


12
Carey A. Smith (Class I)
Age: 60 Director Since: 2020 | Carey A. Smith was elected the President and Chief Executive Officer of Parsons Corporation in July 2021 and Chair of the Board of Directors effective April 14, 2022. Ms. Smith joined Parsons in 2016 as President of our Federal Solutions business and has had progressive roles as the company’s Chief Operating Officer, and President and Chief Operating Officer. During her tenure, Ms. Smith has driven Parsons’ transformation into a balanced federal and infrastructure portfolio and moved the company up the solutions integration value chain. Prior to joining Parsons, Ms. Smith held a series of escalating executive leadership roles within the aerospace and defense industry at both Honeywell and Lockheed Martin, including serving as Honeywell’s President of the Defense and Space business unit. She serves on the board of directors of Edison International, the Professional Services Council non-profit, where she previously served as chair of the board of directors, and the Saudi-Arabia Parsons Ltd (SAPL). Ms. Smith’s recognitions include being a six-time recipient of the Executive Mosaic Wash100, four-time recipient of the WashingtonExec “Top Execs to Watch”,Virginia 500 Power List, top 5 COOs in Government Contracting, Ohio Northern University Alumni of the Year, and Marlington High School Alumni of the Year. In 2023, Ms. Smith was recognized as the GovCon Executive of the Year. Ms. Smith received an honorary doctorate degree from Ohio Northern University, a master’s degree in electrical engineering from Syracuse University and a bachelor-of-science degree in electrical engineering from Ohio Northern University. She has NACD Directorship (NACD.DC) and cyber certifications. |

13
CORPORATE GOVERNANCE AND GENERAL INFORMATION CONCERNING THE BOARD OF DIRECTORS AND ITS COMMITTEES
Our Board and Leadership Structure
Our Board currently consists of eleven Directors, nine of whom are independent. There are no family relationships among our executive officers and Directors. Each incumbent member of the Board attended or participated in 75%90% or more of the aggregate of (i) the total number of meetings of the Board (held during the period for which such person has been a Director) and (ii) the total number of meetings held by all Committees of the Board on which such person served (during the periods that such person served).
Our Board of Directors recognizes that one of its key responsibilities is to evaluate and determine its optimal leadership structure so as to provide effective oversight of management. Our bylaws and corporate governance guidelines provide our Board of Directors with flexibility to combine or separate the positions of ChairmanChair of the Board of Directors and Chief Executive Officer.Officer (CEO). Our Board of Directors currently believes that our existing leadership structure is effective, provides the appropriate balance of authority between independent and non-independent Directors, and achieves the optimal governance model for us and for our stockholders.
Mr. Harrington serves as our Chief Executive Officer and Chairman of the Board of Directors. Our Board believes that Mr. Harrington’s services as Chairman of the Board of Directors is in The Chair/CEO has the best interest of the Company and its stockholders. Mr. Harrington possesses detailed and in-depthin depth knowledge of the issues,company’s opportunities and challenges, we face and is thus best positioned to developdevelops agendas that ensure that the Board of Directors’Board’s time and attention areis focused on the most critical matters. Specifically, his combined role enables decisive leadership, ensures clear accountability,matters, and enhances our ability to communicate our message and strategy clearly and consistently to our stockholders, employees, customers and manufacturers.employees.
Ms. Smith serves as our Chair of the Board of Directors.
Our corporate governance guidelines provide that we have a lead independent Director. Our lead independentLead Independent Director is JamesSteven F. McGovern.Leer. In that role, he callshas called meetings of the independent Directors and chairschaired such meetings, including all executive sessions of the Board of Directors, facilitatesfacilitated communications between our ChairmanChair and the independent Directors of the Board of Directors, and reviewsreviewed the quantity, quality and timeliness of information provided to the Board, among other duties described in our corporate governance guidelines.
Corporate Governance Guidelines
The Board has adopted Corporate Governance Guidelines. The Board and the Corporate Governance and Responsibility Committee are responsible for reviewing and amending these guidelines as they deem necessary and appropriate. The Corporate Governance and Responsibility Committee is responsible for overseeing the system of corporate governance of the Company and the corporation’s environment, social and governance initiatives. The Corporate Governance and Responsibility Committee has reviewed and approved an updated Skills Matrix for Board members (which is included in this proxy statement) and to reflect the Committee’s oversight of climate-related initiatives and documentation. The Corporate Governance Guidelines are available without charge on the Investor Relations portion of our website, www.parsons.com.
We have adopted written codes of conduct and ethics that apply to our Directors, officers and employees, including our principal executive officer, principal financial officer, principal accounting
officer or controller, or persons performing similar functions, and to third parties with whom we conduct business, including agents, representatives, joint venture partners, consultants and subcontractors. We have posted current copies of these codes on our website, www.parsons.com. In addition, we will post on our website all disclosures that are required by law or NYSE listing standards concerning any amendments to, or waivers from, any provision of the codes.
Board Meetings and Attendance
Directors are expected to attend each Board meeting, each meeting of the Committees on which they serve, and the Annual Meeting of Stockholders. During fiscal year 2020,2023, the Board held seven meetings and acted by written consent. Each of our Directors who served as a Director during fiscal 20202023 attended 75%90% or more of the aggregate total number of meetings of the Board (during the time in which they served) and the Board Committees on which he or she served that were held during the time he or she was a director in fiscal 2020. Ms. Smith was appointed to the Board in December 2020 after the final Board meeting for 2020 and, thus, did not participate in any Board meetings during 2020.2023.
Although management is responsible for the day-to-day management of the risks our company faces, our Board of Directors and its Committees take an active role in overseeing the management of our risks and bear the ultimate responsibility for of risk management. The Board of Directors regularly reviews information regarding our operational, financial, legal, data security and strategic risks. Specifically, senior risk management attendspersonnel attend quarterly meetings of the Board, providesprovide presentations on operations including significant risks, and isare available to address any questions or concerns raised by our Board of Directors.
In addition, our four Board of Directors’ Committees assist the Board of Directors in fulfilling its oversight responsibilities in certain areas of risk. The Audit and Risk Committee coordinates the Board of Directors’ oversight of our internal control over financial reporting, disclosure controls and procedures, risk, related party transactions, code of conduct, data and information security. The Compensation and Management Development Committee assists the Board of Directors in fulfilling its oversight responsibilities with respect to the management of risks arising from our compensation policies and programs as well as succession planning as it relates to our Chief Executive Officer and executive leadership. The Corporate Governance and Responsibility Committee assists the Board of Directors in fulfilling its oversight responsibilities with respect to the management of risks associated with Board organization, membership and structure, succession planning for our Directors, and corporate environment, social, and governance (ESG)ESG matters. The Executive Committee assists the Board of Directors in conducting its duties, including meeting with greater frequency than the Board of Directors in connection with key actions to be taken by us, such as major acquisitions, divestitures, mergers or changes in capital structure or ownership, in addition to meeting on an ad hoc basis in order to review major investments or divestitures outside of our normal investment plan. When any of the Committees receives a report related to material risk, the chairmanchair of the relevant Committee will report on the discussion to the full Board of Directors.
Information and Security Risk
Our Chief Security Officeand Risk Officer is responsible for the development, delivery and maintenance of enterprise information, security and risk management programs which safeguard Parsons’ business information, assets, and its supporting infrastructure against unauthorized use, disclosure, modification, damage or loss. Our Security Operations Centers provide continuous monitoring of information systems to prevent, detect, and respond to cyber events.events and to engage with our Chief Legal Officer to discuss such responses and any appropriate disclosure requirements. We also provide training to our global workforce on cyber security awareness, including: Cyber Security Awareness Month,including online
training courses, and interactive discussions on information security.security, and a key role on the corporation’s critical response management committee. Our security control protocols map directly to multiple security compliance frameworks, including ISO 27001, Sarbanes-Oxley, DFARS (NIST 800-171), Cybersecurity Maturity Model Certification, and stringent privacy regulations, such as the General Data Protection Regulation (GDPR) and the California Consumer Privacy Act (CCPA).A full description of the Corporation’s procedures for managing and disclosing cyber-security risks and incidents can be found in Section 1C of the Corporation’s 10-K filed with the Securities and Exchange Commission on February 14, 2024.
Annual Board Performance Assessment
The Board and each of the Audit and Risk, Compensation, and Corporate Governance and Responsibility Committees perform annual assessments of their operations and effectiveness and set goals for the future.
During 2020,2023, the Board and the Committees engaged inperformed an annual assessment process in which each memberinternal self-assessment. The Corporate Governance and Responsibility Committee reviewed the results from prior assessments and considered the business goals and developments of the company in 2020. Each Director and Committee member consideredevaluated the skills, industry and public company experience, independence, and diversity of the Board to allow usand provided feedback for the Board to achieve our business, governance and sustainability objectives. The Lead Independent Director and the Chair of the Corporate Governance and Responsibility Committee and the Lead Independent Director led a discussion of achievements during 20202023 and goals and objectives with the Board.
16
The Skills Matrix reviewed and approved by the Corporate Governance and Responsibility Committee, and the full Board of Directors, is referenced below.
In 2021, an assessment will be performed by an external vendor.
|
|
|
|
|
|
|
|
|
|
|
|
Knowledge, Skills and Experience1 | |||||||||||
End Market Background | |||||||||||
Defense |
|
|
|
|
|
|
| ||||
Intelligence |
|
|
|
|
|
|
| ||||
Infrastructure |
|
|
|
|
|
|
| ||||
Technical Skills and Expertise | |||||||||||
Financial |
|
|
|
|
|
|
|
| |||
Capital Markets |
|
|
|
|
| ||||||
ESG |
|
|
|
|
|
| |||||
Regulatory/Govt. Contracting |
|
|
|
|
|
|
|
|
| ||
HR/Compensation |
|
|
|
|
|
|
|
|
| ||
Operations/Risk Management |
|
|
|
|
|
|
|
| |||
Strategic Planning |
|
|
|
|
|
|
|
|
|
|
|
Technology/Innovation |
|
|
|
|
|
| |||||
Mergers and Acquisitions |
|
|
|
|
|
|
|
| |||
IT and Cyber |
|
|
|
|
|
|
| ||||
Corporate Governance/Ethics |
|
|
|
|
|
|
|
|
|
|
|
Demographics | |||||||||||
Race/Ethnicity | |||||||||||
African American |
| ||||||||||
Asian/Pacific Islander | |||||||||||
White/Caucasian |
|
|
|
|
|
|
|
|
|
| |
Hispanic/Latino | |||||||||||
Native American | |||||||||||
Gender | |||||||||||
Male |
|
|
|
|
|
|
| ||||
Female |
|
|
|
| |||||||
Board Tenure | |||||||||||
Years | 4 | 11 | 2 | 18 | 4 | 2 | 4 | 6 | 11 | 10 | 4 |


1 All Board members have public company and Executive Experience.
Board Independence
Nine of our current eleven Directors and all of our nominated Directors in 2021, are independent under our Corporate Governance Guidelines and applicable New York Stock Exchange (“NYSE”) listing standards. The Board has determined that Messrs. Holdsworth, Leer, McDew, McGovern, McMahon, Mitchell, and Wajsgras, and Mmes. Long, Lord and Vautrinot are independent under the independence criteria for directors established by the NYSE. As a result, we currently have a majority of independent Directors and satisfy the applicable rule of the NYSE.
Selection of Nominees for Election to the Board
Both the Corporate Governance and Responsibility Committee and the Board of Directors seek the talents and backgrounds that would be most helpful to Parsons in selecting nominees to the Board. In particular, the Corporate Governance and Responsibility Committee, when recommending director candidates to the full Board of Directors for nomination, may consider whether a director candidate, if elected, assists in achieving a mix of Board members that represents a diversity of background and experience. In addition, our corporate governance guidelines provide that a director shall retire from our Board at the next annual meeting of stockholders after he or she has reached the age of 75.
Our Commitment to Board Diversity
The Board is committed to diversity and focuses on diversity in seeking new candidates to be considered for the Board. We currently have threefour female Directors (Ms. Long, Ms. Lord, Ms. Smith and Ms. Vautrinot) on the Board and one African American male (Mr. McDew).
Process for Stockholders to Recommend Director Nominees
Stockholders wishing to nominate a candidate for director at an annual meeting must (a) provide Timely Notice (as defined in Section 2.04(ii) of the Company’s bylaws) to the Secretary of the Corporation, (b) provide the information, agreements and questionnaires with respect to such stockholder and its candidate for nomination as required to be set forth in the Company’s Amended
and Restated Bylaws, and (c) provide any updates or supplements to such notice at the times and in the forms required by the Bylaws.
Director Orientation and Continuing Education
Each new member of the Board is provided with orientation materials and is required to attend meetings with the Executive Leadership team. In these meetings, discussion points included finance, legal, talent management and corporate strategy. In 2020,2023, the Board received presentations from internal and external sources and a list of continuing education opportunities to consider.
Any stockholder or other interested party may contact the Board, including any non-employee Director or the non-employee Directors as a group, or the ChairmanChair by writing to our corporate Secretary at 5875 Trinity Parkway #300, Centerville,14291 Park Meadow Drive, Suite 100, Chantilly, VA 20120.20151. In general, any stockholder communication delivered to our Corporate Secretary for forwarding to the Board, the ChairmanChair or a specified group of Board members will be forwarded in accordance with the stockholder’s instructions. However, our Corporate Secretary reserves the right not to forward to Board members any abusive, threatening or otherwise inappropriate materials.
Our Board has fourhad three standing Committees: An Executive Committee,Committees in 2023: an Audit and Risk Committee, a Compensation and Management Development Committee, and a Corporate Governance and Responsibility Committee. The charter of each Committee is available without charge on the Investor Relations portion of our website, www.parsons.com.www.parsons.com.
18
The following chart identifies the current members and chair of each standing Committee, as well as related information.
Audit and Risk Committee | Compensation & | Corporate |
| |
| ||||
|
|
| ||
|
|
| ||
|
|
| ||
|
|
| ||
Gen. Darren W. McDew, USAF (ret) |
|
| ||
Harry T. |
|
|


| ||||
|
|
| ||
Carey A. Smith | ||||
Major General Suzanne M. “Zan” Vautrinot, USAF (ret) |
|
| ||
David C. Wajsgras |
|
|


| Committee Chair |
| Committee Member |


Committee Chair Committee Member
The following is a brief description of our Committees.
Executive Committee
The Executive Committee is responsible for providing our Board of Directors with considerations and recommendations regarding our business strategy. In addition, among other matters, the Executive Committee is responsible for reviewing key actions to be taken by us, such as major mergers, acquisitions, major investments or divestitures of assets outside our normal investment plans, and conducting periodic reviews of the Executive Committee’s performance, assessing the adequacy of its charter and recommending changes to the Board of Directors. The Executive Committee is authorized with all the powers of the Board of Directors, except for powers specifically denied by the Executive Committee charter, including, but not limited to, declaring or paying dividends, amending our bylaws or articles of incorporation, issuing stock and making or approving capital expenditures exceeding $5.0 million. The current members of our Executive Committee are Mr. Harrington (chairperson), Mr. McGovern, Mr. Holdsworth, Mr. Leer and Mr. Mitchell. Other than Mr. Harrington, all members of the Executive Committee are independent under our Corporate Governance Guidelines and applicable New York Stock Exchange (“NYSE”) listing standards.
The Executive Committee met twice during fiscal year 2020. A Pricing Committee appointed by the Board and comprised of Executive Committee and additional members also met one time during 2020 to review a convertible note transaction.
Audit and Risk Committee
Our Audit and Risk Committee oversees our corporate accounting and financial reporting process. Among other matters, the Audit and Risk Committee:
appoints our independent registered public accounting firm;
evaluates the independent registered public accounting firm’s qualifications, independence and performance;
determines the engagement of the independent registered public accounting firm;
reviews and approves the scope of the annual audit and the audit fee;
19
approves the retention of the independent registered public accounting firm to perform any proposed permissible non-audit services;
monitors the rotation of partners of the independent registered public accounting firm on our engagement team in accordance with requirements established by the SEC;
reviews our financial statements and our management’s discussion and analysis of financial condition and results of operations to be included in our annual and quarterly reports to be filed with the SEC;
reviews our risk management procedures and risk factors affecting Parsons;
reviews our critical accounting policies and estimates;
reviews information and security operations and risk exposure; and
at least annually, reviews the Audit and Risk Committee charter and reviews and evaluates the performance of the Audit and Risk Committee and its members, including compliance by the Audit and Risk Committee with its charter.
The current members of our Audit and Risk Committee are Mr. Mitchell (chairperson), Mr. Leer, Ms. Long, Mr. McMahon, Ms. Vautrinot and Mr. Wajsgras. All members of the Audit and Risk Committee are independent under our Corporate Governance Guidelines and applicable New York Stock Exchange (“NYSE”) listing standards.
All members of our Audit and Risk Committee meet the requirements for financial literacy under the applicable rules and regulations of the SEC and the NYSE. Our Board of Directors has determined that M. Christian Mitchell, Steven F. Leer, and David C. Wajsgras are Audit and Risk Committee financial experts as defined under the applicable rules of the SEC and have the requisite financial sophistication as defined under the applicable rules and regulations of the NYSE. Under the rules of the SEC, members of the Audit and Risk Committee must also meet heightened independence standards. However, a minority of the members of the Audit and Risk Committee may be exempt from the heightened Audit and Risk Committee independence standards for one year from the date of effectiveness of the registration statement of which this prospectus forms a part. Our Board of Directors has also determined that each of the members are independent under the heightened Audit and Risk Committee independence standards of the SEC and the NYSE. The Audit and Risk Committee operates under a written charter that satisfies the applicable standards of the SEC and the NYSE.
The Audit and Risk Committee met eight times during fiscal year 2020.2023. The Audit and Risk Committee is briefed at least quarterly on information security operations mitigation measures to address risks related to Parsons’ global employees, information, and assets.
20
Compensation and Management Development Committee
Compensation Committee
Our Compensation and Management Development Committee reviews and recommends policies relating to compensation and benefits of our officers and employees. Among other matters, the Compensation and Management Development Committee:
reviews and approves corporate goals and objectives relevant to compensation of our chief executive officer and other executive officers;
evaluates the performance of these officers in light of those goals and objectives, and approves the compensation of these officers based on such evaluations;
approves the issuance of stock options and other awards under our long-term incentive plans, other than awards to non-employee members of our Board of Directors; and
at least annually, reviews the Compensation and Management Development Committee charter and reviews and evaluates the performance of the Compensation and Management Development Committee and its members, including compliance by the Compensation and Management Development Committee with its charter.
The current members of our Compensation and Management Development Committee are Mr. Leer (chairperson), Mr. Holdsworth, Ms. Lord, Mr. McDew, Mr. McMahon, Ms. Vautrinot and Mr. Wajsgras. All members of the Compensation and Management Development Committee are independent under our Corporate Governance Guidelines and applicable New York Stock Exchange (“NYSE”) listing standards.
Our Board of Directors has determined that each of the members of our Compensation and Management Development Committee is independent under the applicable rules and regulations of the NYSE and is a “non-employee director” as defined in Rule 16b-3 promulgated under the Exchange Act. The Compensation and Management Development Committee operates under a written charter that satisfies the applicable standards of the SEC and the NYSE.
The Compensation and Management Development Committee met sixfive times during fiscal year 20202023 and also acted by written consent.
Corporate Governance and Responsibility Committee
The Corporate Governance and Responsibility Committee is responsible for making recommendations to our Board of Directors regarding candidates for directorships and the size and composition of our Board of Directors. All members of the Corporate Governance and Responsibility Committee are independent under our Corporate Governance Guidelines and applicable New York Stock Exchange (“NYSE”) listing standards.
The Corporate Governance and Responsibility Committee is responsible for overseeing our corporate governance policies and reporting, making recommendations to our Board of Directors concerning environment,environmental, social and governance (ESG) matters. The Corporate Governance and Responsibility Committee will also, at least annually, review its Committee charter and review and evaluate the performance of the Corporate Governance and Responsibility Committee and its members, including compliance by the Committee with its charter.
21
The current members of our Corporate Governance and Responsibility Committee are Ms. Vautrinot (chairperson), Mr. Holdsworth, (chairperson), Ms. Long, Ms. Lord, Mr. McDew, and Mr. McGovern, Mr. Mitchell and Ms. Vautrinot.Mitchell. Our Board of Directors has determined that each of the members of our Corporate Governance and Responsibility Committee is an independent director under the applicable rules and regulations of the NYSE relating to Corporate Governance and Responsibility Committee independence. The Corporate Governance and Responsibility Committee operates under a written charter that satisfies the applicable standards of the SEC and the NYSE.
The Corporate Governance and Responsibility Committee met sixfour times during fiscal year 2020.2023.
On January 1, 2020, our Board adopted stock ownership guidelines which provide for equity ownership guidelines for all our non-employee Directors to further align their interests to those of our stockholders. Under the policy, each of our non-employee Directors has five years from the later of (i) January 1, 2020 or (ii) the date of commencement of his/her service on the Board to achieve equity
ownership with a value equivalent to five times his/her annual cash retainer. In calculating a director’s ownership, common stock held by the non-employee director or an immediate family member, common stock owned indirectly if the individual has an economic interest in the shares or is a beneficial owner under RueRule 13d-3 of the Exchange Act, unvested RSUsRestricted Stock Units (RSUs) issued under the Parsons’ Incentive Plan and units held in deferral accounts by the Directors under the SVRPShare Value Retirement Plan (“SVRP”) will be considered owned by the non-employee director. Value of ownership will be measured by reference to the trailing 60 trading day weighted average of the Parsons common stock, up to and including last day of the calendar year; compliance will be evaluated annually. In the event of a significant decline in stock price, causing non-employee Directors holdings to fall below guideline levels, non-employee Directors will not be required to purchase additional stock. Determination of the impact of share price fluctuation is subject to Compensation and Management Development Committee discretion. In 2021, the Corporate Governance and Responsibility Committee adopted a resolution requiring the implementation of a Rule 10b5-1 trading plan for any director and member of the executive leadership team (reporting to the CEO) prior to being able to sell any shares of Parsons’ stock.
For a description of the guidelines applicable to executive officers, see our CD&A section of this Proxy.
Anti-Hedging and Anti-Pledging Policies
Under our Insider Trading Compliance Policy, we prohibit our employees, including our executive officers, and Board members, from hedging the risk associated with ownership of shares of our common stock and other securities, as well as from pledging any of our securities as collateral for a loan.
COMPENSATION AND MANAGEMENT DEVELOPMENT COMMITTEE INTERLOCKSINTERLOCKS AND INSIDER PARTICIPATION
The current members of our Compensation and Management Development Committee are Messrs. Leer, Holdsworth, McDew, McMahon, and Wajsgras and Ms. Vautrinot.Lord. No member of our Compensation and Management Development Committee serves who served on such committee during 2023 served as a member of the Board or Compensation and Management Development Committee of any other entity that has one or more executive officers serving as a member of our Board or Compensation and Management Development Committee.
23
SECURITY OWNERSHIP INFORMATION
Security Ownership of Directors and Executive Officers
The following table indicates information as of February 19, 202120, 2024 regarding the beneficial ownership of our common stock by each of our Directors, each of the named executive officers, and all of our Directors and executive officers as a group. Per our guidelines, 100% of the Board of Directors are permitted to own Parsons’ stock.
The percentages shown are based on 102,360,662105,829,579 shares of common stock outstanding as of February 19, 2021.20, 2024.
The amounts and percentages owned are reported on the basis of the SEC’s rules governing the determination of beneficial ownership of securities. The SEC’s rules generally attribute beneficial ownership of securities to each person who possesses, either solely or shared with others, the voting power or investment power, which includes the power to dispose of those securities. The rules also treat as outstanding all shares of capital stock that a person would receive upon exercise of stock options or warrants held by that person that are immediately exercisable or exercisable within 60 days. These shares are deemed to be outstanding and to be beneficially owned by the person holding those options for the purpose of computing the number of shares beneficially owned and the percentage ownership of that person, but they are not treated as outstanding for the purpose of
computing the percentage ownership of any other person. Under these rules, one or more persons may be a deemed beneficial owner of the same securities and a person may be deemed a beneficial owner of securities to which such person has no economic interest. Unless otherwise indicated, the persons or entities identified in this table have sole voting and investment power with respect to all shares shown as beneficially owned by them, subject to applicable community property laws as of February 19, 2021.20, 2024.
|
| Shares Beneficially |
|
| % of | ||||||||
|
| Shares |
|
| % |
|
| % | |||||
Named Executive Officers and Directors: |
|
|
|
|
|
|
|
|
|
| |||
Carey A. Smith(1)(2) |
|
| 307,501 |
|
| * |
|
| * |
|
| ||
Matthew Ofilos(1) |
|
| 36,446 |
|
| * |
|
| * |
|
| ||
Michael R. Kolloway(1)(2) |
|
| 76,181 |
|
| * |
|
| * |
|
| ||
Susan M. Balaguer(1)(2) |
|
| 28,958 |
|
| * |
|
| * |
|
| ||
George L. Ball(1)(2)(3) |
|
| 332,490 |
|
|
| — |
|
|
| — |
|
|
Mark K. Holdsworth |
|
| 22,110 |
|
|
| — |
|
|
| — |
|
|
Steven F. Leer |
|
| 22,110 |
|
|
| — |
|
|
| — |
|
|
Letitia A. Long |
|
| 17,367 |
|
|
| — |
|
|
| — |
|
|
Ellen M. Lord |
|
| 6,789 |
|
|
| — |
|
|
| — |
|
|
Darren W. McDew, General USAF (ret) |
|
| 17,367 |
|
|
| — |
|
|
| — |
|
|
Harry T. McMahon |
|
| 27,110 |
|
|
| — |
|
|
| — |
|
|
M. Christian Mitchell |
|
| 22,110 |
|
|
| — |
|
|
| — |
|
|
Major General Suzanne M. “Zan” Vautrinot, USAF (ret) |
|
| 22,110 |
|
|
| — |
|
|
| — |
|
|
David C. Wajsgras |
|
| 28,528 |
|
|
| — |
|
|
| — |
|
|
All executive officers and directors as a group (16 persons)(4) |
|
| 967,176 |
|
| * |
|
| * |
|
| ||
5% Stockholders: |
|
|
|
|
|
|
|
|
|
| |||
Parsons Corporation Employee Stock Ownership Plan |
|
| 59,222,217 |
|
|
| 56.0 | % |
|
| 56.0 | % |
|
* less than 1%.
|
| Shares Beneficially Owned |
|
| % of Outstanding Shares Beneficially Owned | |||||||||
|
| Shares |
|
| % |
|
| % | ||||||
Named Executive Officers and Directors: |
|
|
|
|
|
|
|
|
|
|
|
|
|
|
Charles L. Harrington(1)(2) |
|
| 154,758 |
|
| * |
|
|
| * |
|
| ||
George L. Ball(3) |
|
| 146,726 |
|
| * |
|
|
| * |
|
| ||
Carey A. Smith(1)(2) |
|
| 19,169 |
|
| * |
|
|
| * |
|
| ||
Michael R. Kolloway(1)(2) |
|
| 20,030 |
|
| * |
|
|
| * |
|
| ||
Debra A. Fiori(1)(2) |
|
| 21,313 |
|
| * |
|
|
| * |
|
| ||
Kenneth C. Dahlberg |
|
| — |
|
|
| — |
|
|
|
| — |
|
|
Mark K. Holdsworth |
|
| — |
|
|
| — |
|
|
|
| — |
|
|
Steven F. Leer |
|
| — |
|
|
| — |
|
|
|
| — |
|
|
Letitia A. Long |
|
| — |
|
|
| — |
|
|
|
| — |
|
|
Darren W. McDew, General USAF (ret) |
|
|
|
|
|
|
|
|
|
|
|
|
|
|
James F. McGovern |
|
| — |
|
|
| — |
|
|
|
| — |
|
|
Harry T. McMahon |
|
| 25,800 |
|
|
| — |
|
|
|
| — |
|
|
M. Christian Mitchell |
|
| — |
|
|
| — |
|
|
|
| — |
|
|
Major General Suzanne M. “Zan” Vautrinot, USAF (ret) |
|
|
|
|
|
| — |
|
|
|
| — |
|
|
David C. Wajsgras |
|
|
|
|
|
|
|
|
|
|
|
|
|
|
All executive officers and directors as a group (12 persons)(4) |
|
| 387,796 |
|
| * |
|
|
| * |
|
| ||
5% Stockholders: |
|
|
|
|
|
|
|
|
|
|
|
|
|
|
Parsons Corporation Employee Stock Ownership Plan |
|
| 76,076,020 |
|
|
| 74.3 | % |
| 74.3% | ||||
24
|
|
|
|
|
|
|
|
|
|
DELINQUENT SECTION 16(A) REPORTS
Section 16(a) of the Exchange Act requires our directors, officers (as defined in Rule 16a-1 promulgated under the Exchange Act) and stockholders who beneficially own more than 10% of any class of our equity securities registered pursuant to Section 12 of the Exchange Act (collectively, the “Reporting Persons”) to file initial statements of beneficial ownership of securities and statements of changes in beneficial ownership of securities with respect to our equity securities with the SEC. Based solely on our review of the copies of such forms received by us and upon written representations of the Reporting Persons received by us, we believe that there has been compliance with all Section 16(a) filing requirements applicable to such Reporting Persons with respect to the fiscal years ended December 31, 2019, 2020, 2021, 2022 and 2023, and for the first wo months of 2024, except for Form 4 reflecting transactions for each of the following Section 16 officers to reflect shares of Restricted Stock Units withheld upon subsequent vesting. All of such RSUs were previously reported in full at the time such RSUs were granted, and, in all cases, the subsequent withholding was for the purpose of the payment of taxes upon the vesting of RSU shares: Carey A. Smtih (fourteen withholding events ); George L. Ball (nine withholding events); Matthew M. Ofilos (four withholding events); Michael R. Kolloway (eleven withholding events); and Susan M. Balaguer (four withholding events).
CERTAIN RELATIONSHIPSRELATIONSHIPS AND RELATED PARTY TRANSACTIONS
Contributions of treasury stock to the ESOP are made annually in amounts determined by our Board of Directors and are held in trust for the sole benefit of the ESOP participants. Contributions of 1,874,988915,113 shares, 1,345,1981,188,129 shares and 1,522,3811,631,477 shares of our common stock were made to the ESOP in fiscal 2018, 20192023, 2022 and 2020,2021, respectively. In fiscal 2018, 2019 and 2020, we repurchased 5,553,891 shares, 191,331 shares and 0 shares of our common stock from the ESOP, respectively, in connection with the redemption of ESOP participants’ interests in the ESOP for $125.8 million, $6.3 million and $0, respectively.
We engaged the ESOP Trustee to serve as independent fiduciary on behalf of the ESOP and its participants and beneficiaries. We paid the ESOP Trustee a fee of $426,128$454,675 in 2023 for those services and reimbursed the ESOP Trustee for their legal counsel, financial advisor, and other out of pocket fees and expenses incurred in connection with our initial public offering.
We often provide services to our unconsolidated joint ventures and our revenues include amounts related to recovering overhead costs for these services. Our revenues included $144.7$213.8 million in fiscal year 2018, $157.32023, $217.4 million in fiscal year 2019,2022, and $172.2$204.7 million in fiscal year 20202021 related to services we provided to our unconsolidated joint ventures. For the years ended December 29, 201831, 2023, December 31, 2022, and December 31, 2019, and December 31, 2020,2021, we incurred approximately $111.1$153.7 million, $119.1$157.6 million, and $133.8$155.5 million, respectively, of reimbursable costs.
We entered into a registration rights agreement with the ESOP Trustee, providing the ESOP with certain demand registration rights related to shares held by the ESOP in the event the ESOP Trustee determines in good faith, in exercising its fiduciary duties under ERISA, that the ESOP is required to sell its shares, which we believe is only likely to occur if our business, financial condition or results of operations have materially and adversely deteriorated.
ESOP Trustee Letter Agreement
We entered into a letter agreement with the ESOP Trustee in connection with our initial public offering, in which we agree that our management will meet with the ESOP Trustee on a quarterly basis to discuss our business and the administration and operation of the ESOP and that our Board of Directors will meet with the ESOP Trustee on an annual basis to discuss our business and the administration and operation of the ESOP. In addition, we also agree that forThe amount of contribution in fiscal 2020, we will make annual contributions (inyear 2023, as determined by the formParsons Corporation Board of shares of our common stock) to the ESOP in an amountDirectors was not to be less than 8% of the ESOP participants’ cash compensation for the applicable year. The amount of contribution of the ESOP participants’ compensation for fiscal year 2021 and thereafter shall be determined by the Parsons Corporation Board of Directors.
Indemnification Agreements and Directors’ and Officers’ Liability Insurance
We have entered into indemnification agreements with each of our Directors and executive officers. These agreements, among other things, require us to indemnify each director and executive
officer to the fullest extent permitted by Delaware law, including indemnification of expenses such as attorneys’ fees, judgments, penalties fines and settlement amounts incurred by the director or executive officer in any action or proceeding, including any action or proceeding by or in right of us, arising out of the person’s services as a director or executive officer. We also maintain Directors’ and officers’ liability insurance.
Our written related person transaction policy sets forth the policies and procedures for the review and approval or ratification of related person transactions. This policy covers, with certain exceptions set forth in Item 404 of Regulation S-K under the Securities Act, any transaction, arrangement or relationship, or any series of similar transactions, arrangements or relationships in which we were or are to be a participant, where the amount involved exceeds $120,000 and a related person had or will have a direct or indirect material interest, including, without limitation, purchases of goods or services by or from the related person or entities in which the related person has a material interest, indebtedness, guarantees of indebtedness and employment by us of a related person. In reviewing and approving any such transactions, our Audit and Risk Committee is tasked to consider all relevant facts and circumstances, including, but not limited to, whether the transaction is on terms comparable to those that could be obtained in an arm’s length transaction with an unrelated third party and the extent of the related person’s interest in the transaction. All of the transactions described in this section occurred prior to the adoption of this policy.
COMPENSATION DISCUSSIONDISCUSSION AND ANALYSIS
This Compensation Discussion and Analysis (“CD&A”), together with the compensation tables and related disclosures, discusses the principles underlying our executive compensation policies and decisions and the most important factors relevant to an analysis of these policies and decisions. In addition, we explain how and why our Board and the Compensation and Management Development Committee of our Board arrived at specific compensation policies and decisions involving our NEOsnamed executive offices (NEOs) during fiscal 2020.2023.
Our named executive officers (“NEOs”)NEOs for 20202023 were:
Charles L. Harrington, Chairman, Chief Executive Officer and Director
Carey A. Smith, Chair, President and Chief OperatingExecutive Officer and Director
George L. Ball,Matthew Ofilos, Chief Financial Officer
Michael R. Kolloway, Chief Legal Officer and Secretary
Debra A. Fiori,Susan M. Balaguer, Chief PeopleHuman Resources Officer
26
Executive Summary
Company Performance and Highlights
How We Performed in Fiscal | ||
• Achieved record revenue of $5.4 billion. • Achieved net income of $161.1 million. • Achieved record adjusted EBITDA in 2023 of $464.7 million driven by strong performance in both of our business segments. Adjusted EBITDA margin was 8.5%. • Successful capital deployment in M&A continues with Sealing Technologies, IPKeys, and I.S. Engineers to enhance Parsons' capabilities in defensive cyber operations; integrated mission-solutions powered by artificial intelligence and machine learning; edge computing; edge access modernization; critical infrastructure protection and secure data management that protects national security; and transportation engineering. • Healthy balance sheet will continue to enable Parsons to invest in organic and M&A growth opportunities. •
Trailing-twelve-month enterprise book-to-bill ratio of $8.6 billion, representing two years of annual revenue. • Won 15 large contracts each in excess of $100 million in growing and enduring markets, including • Enhanced our executive leadership team with proven industry and growth leaders through hiring and promotions. • Achieved notable recognition as an employer of choice from military/veterans, diversity, and other groups and achieved several notable highlights as shown in the | ||
27
Key 20202023 Executive Compensation Decisions
| ||
• Pay Aligned with Performance. We designed a majority of our CEO’s and NEOs’ pay packages to be “at-risk” and aligned with stockholder interests. This “at-risk” pay will only reward executives for positive financial, strategic, and/or stock performance, which aligns the interests of our NEOs with those of stockholders. • Market Data Considered in Designing Competitive Compensation Program. Our Compensation and Management Development Committee reviewed Parsons’ long-term business and talent strategy alongside market compensation levels and program
decisions. • Consideration of Relevant Factors and Independent Compensation Consultant | ||
28

| ||
•
Annual Incentives Paid at In February 2024, following the
• Long-Term Incentives Weighted Towards Performance-Based Awards. For
• Vesting of • Dodd-Frank Compliant Compensation Clawback Policy Adoption. In October 2023, the Committee adopted the Parsons Dodd-Frank Compliant Compensation Clawback Policy which provides for the recovery of certain incentive compensation in the event of an Accounting Restatement. This Policy is designed to comply with, and shall be interpreted to be consistent with, Section 10D of the Securities Exchange Act of 1934, as amended, Rule 10D-1 promulgated under the Exchange Act and Section 303A.14 of the New York Stock Exchange Listed Company Manual. | ||
29

Key Changes We Are Making to the Executive Compensation Program for | |||
• Focus on Diversity in Leadership in our CEO and Other NEOs Annual Bonus |
| ||
Say-on-Pay
Say-on-Pay
In evaluating the Company's executive compensation program, the Compensation and Management Development Committee considers the results of the shareholderstockholder advisory vote on the "say-on-pay" proposal. At the Company's 20202023 Annual Meeting, over 98%97% of the shares voted approved the proposal. The Compensation and Management Development Committee believes these results show significant support for our executive compensation philosophy and program. Taking into account the positive support received in 2020,2023, the Compensation and Management Development Committee believes the Company provides a competitive, stockholder-friendly pay program that effectively retains and motivates our executives and determined to generally retain our existing approach to executive compensation for 2021.2024.
Fiscal Year 20202023 Total Target Compensation Pay Mix
|
|
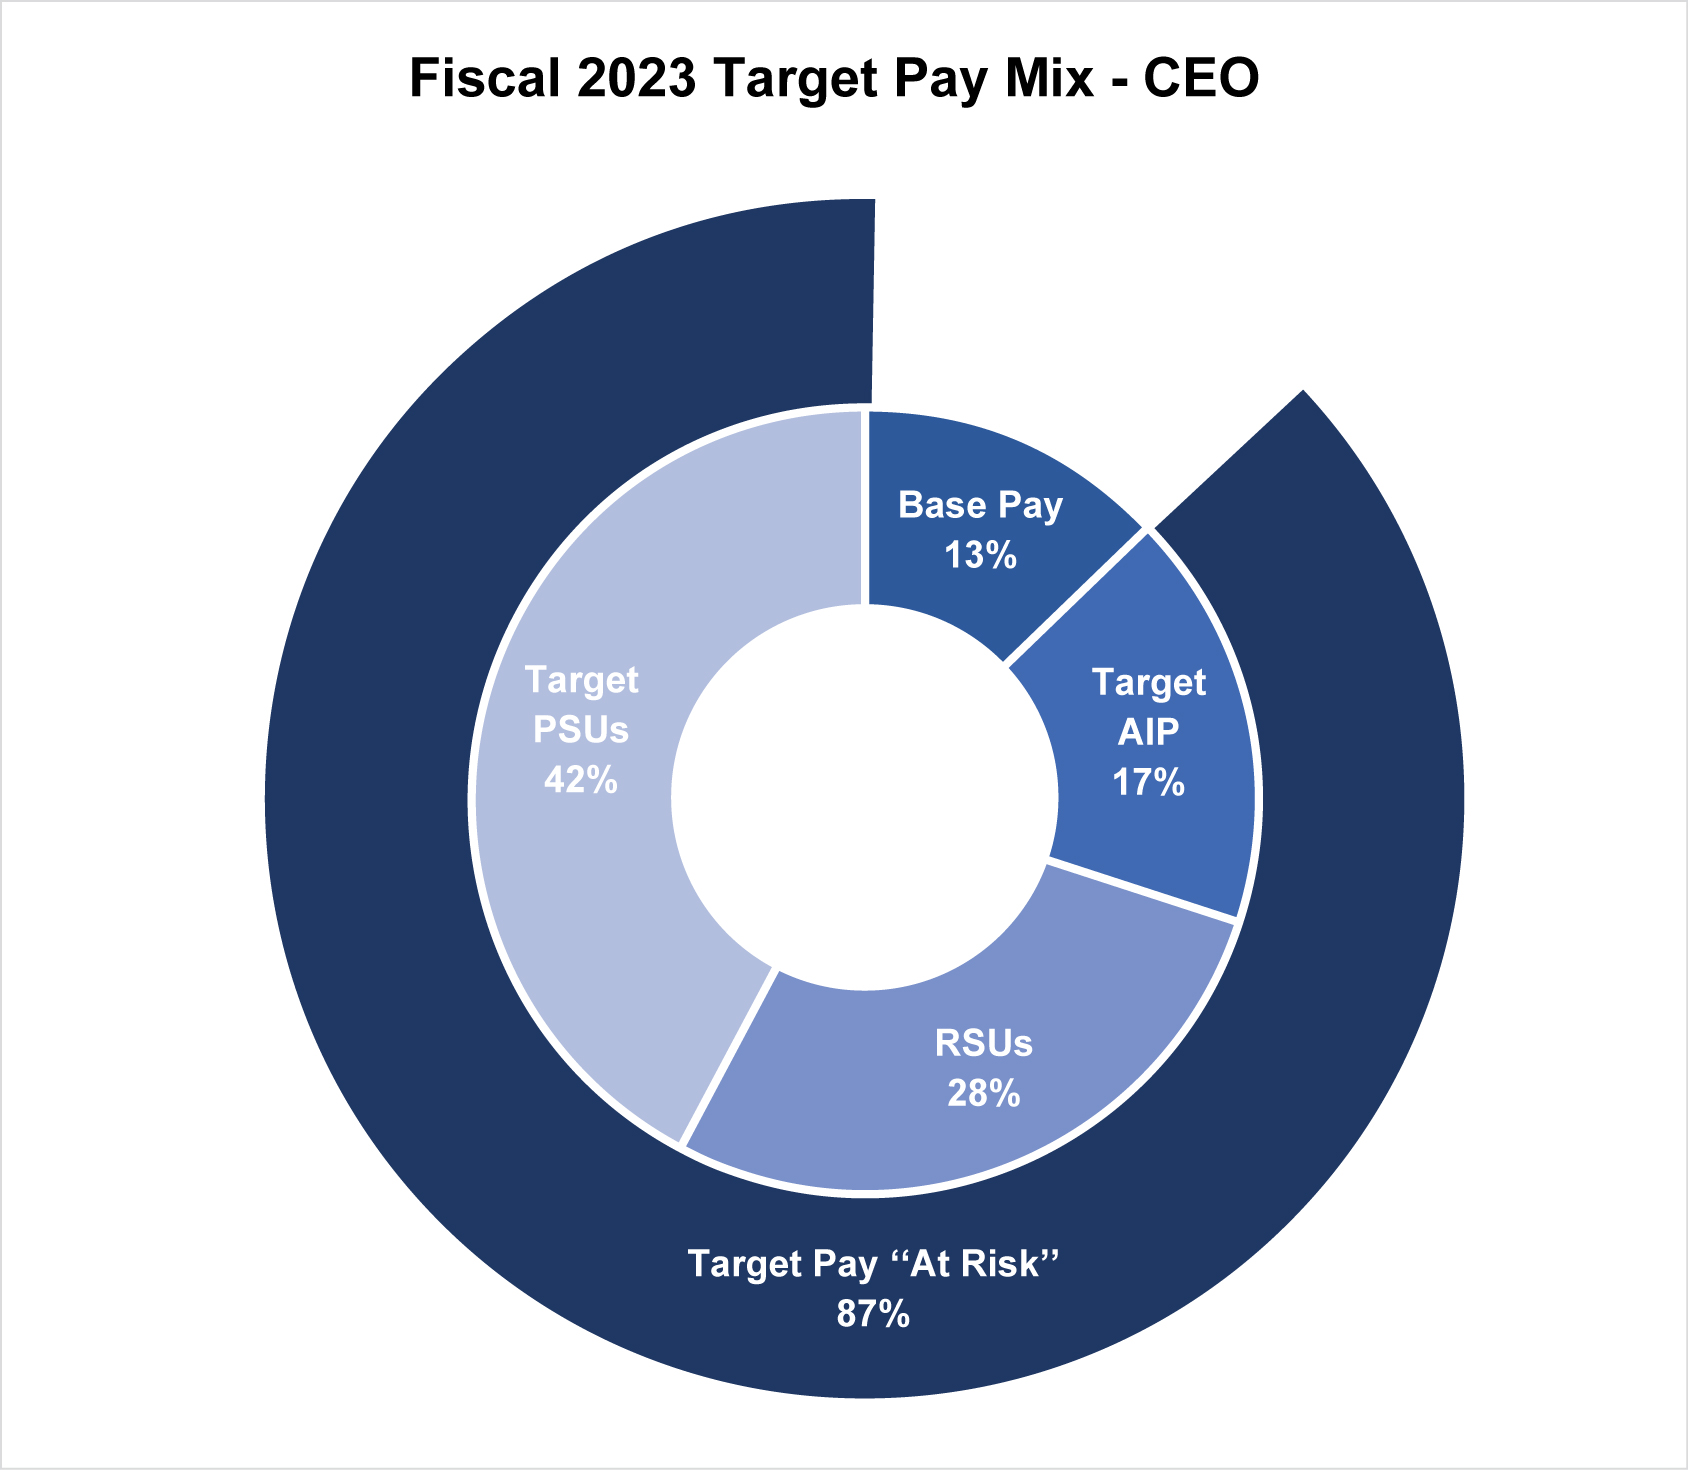
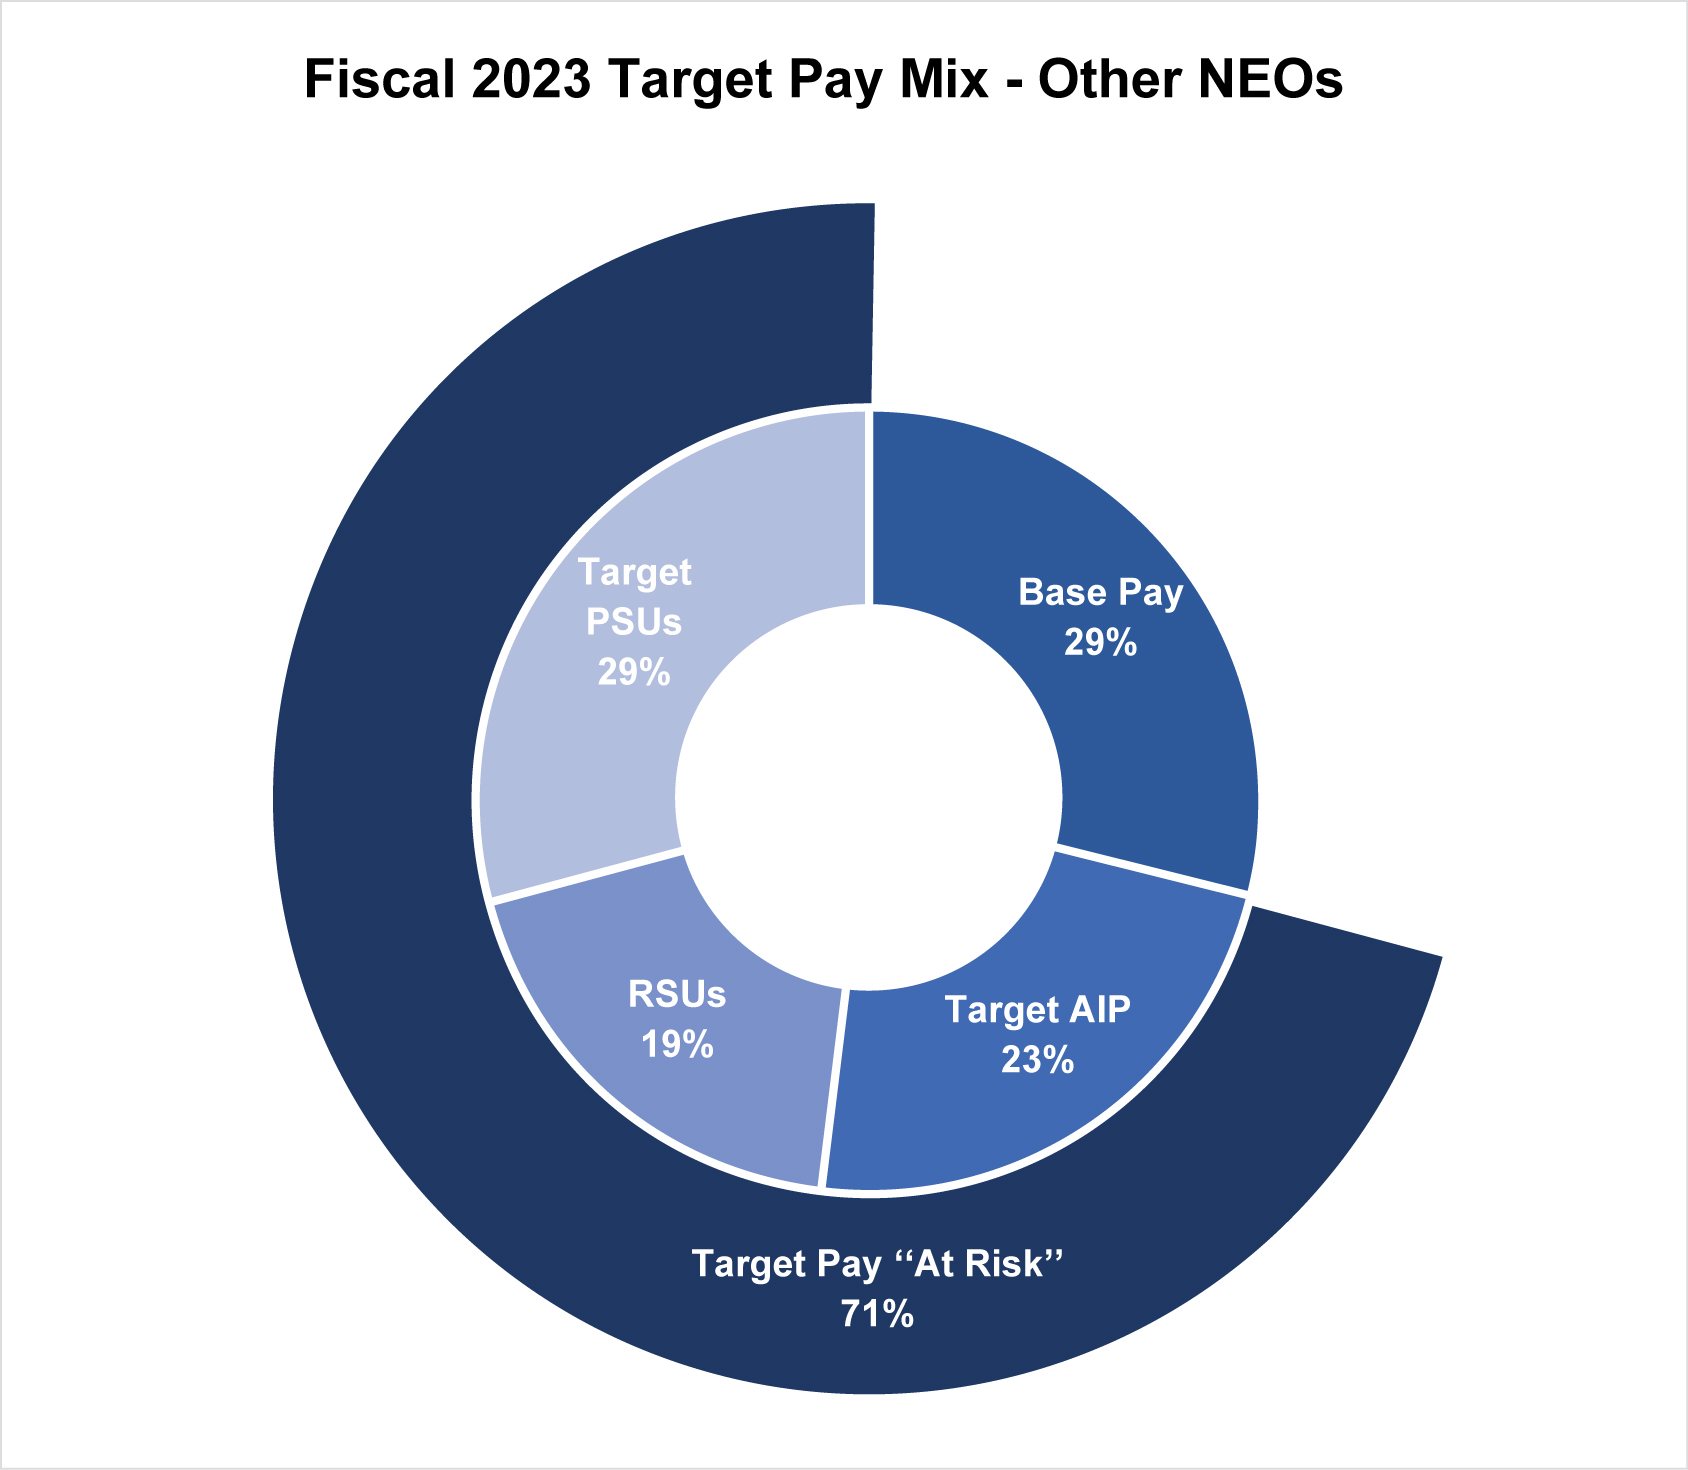


30
Key Executive Compensation Practices
Our executive compensation program includes the following executive compensation governance policies and practices:
Our Compensation Best Practices | ||||
What We Do: | What We Do Not Do: | |||
|
| |||
|
| |||
|
| |||
|
| |||
|
| |||
|
| |||


31
|
|


We believe in providing a competitive total compensation package to our NEOs through a combination of base salary, performance-based annual incentive awards, long-term incentive awards and broad-based welfare and health benefit plans. Our executive compensation program is designed to achieve the following objectives:
attract, motivate and retain executive officers of outstanding ability and potential, whose knowledge, skills and performance are critical to our success;
reward the achievement of short-term and long-term strategic goals; and
ensure that executive compensation is meaningfully related to the creation of stockholder value.
Executive Compensation Setting Process
Role of the Compensation and Management DevelopmentCommittee
Our Board has delegated to the Compensation and Management Development Committee the responsibility for overseeing, reviewing, and approving our compensation arrangements and benefit plans and policies, and certain responsibilities relating to talent management programs and policies. Our Compensation and Management Development Committee annually determines and approves ongoing compensation arrangements for our executive officers and recommends to the Board the compensation for non-employee Directors.
Role of Executive Officers
Our CEO, as a member of our Board, attends Board and portions of Compensation and Management Development Committee meetings and provides input to the Committee in determining our executive compensation philosophy, design, incentive target amounts, and incentive payouts (other than for himself)herself). Our finance department works with our Chief People OfficerCHRO and CEO to gather financial and operational data that the CEO reviews in making hisher recommendations. From time to time our Chief Financial OfficerCFO and Chief Legal OfficerCLO attend meetings (or portions thereof) of the Board or the Compensation and Management Development Committee to present information and answer questions pertaining to our executive compensation structure. No executive officer, including our CEO, participates directly in the final deliberations and determinations regarding his or her own compensation. While the Compensation and Management Development Committee considers management’s recommendations in its deliberations, it exercises its own independent judgment in approving the final compensation of our NEOs.
Role of Compensation Consultant
Pearl Meyer & Partners, LLC, or Pearl Meyer, a national compensation consulting firm, assistedSemler Brossy was retained by the Compensation and Management Development Committee to assist in developing our NEO compensation program for 2020. Among other things, the Compensation Committee directed Pearl Meyer to provide its2023. Semler Brossy provided analysis of whetherand perspectives on our existing compensation strategy and practices were consistent with our compensation objectivesassisted the Compensation and to assist usManagement Development Committee in modifying our compensation program for our NEOs to better achieve our objectives. As
part of itsit's duties, Pearl MeyerSemler Brossy has performed the following projects for the Compensation and Management Development Committee in 2023:
updated the Compensation and Management Development Committee on emerging trends and best practices in the area of executive compensation;
provided compensation data for similarly situated NEOs at our peer group companies; and
updated the Compensation Committee on emerging trends and best practicesassisted in the areadesign of executive compensation.the December 2023 one-time equity award package to Ms. Smith.
32
Other than advising the Compensation and Management Development Committee as described above, Pearl MeyerSemler Brossy did not provide any services to Parsons in 2020. In November 2020, the2023. The Compensation Committee retained Semler Brossy Consulting Group, LLC, which we refer to as Semler Brossy, as its independent compensation consultant. Semler Brossy did not assist in the development of the 2020 executive program, however, they did assist with the stated 2021 executive compensation program changes. The Compensationand Management Development Committee has evaluated the independence of Pearl Meyer and Semler Brossy pursuant to the requirements of the NYSE and the factors set forth in the SEC rules and determined that Pearl Meyer and Semler Brossy are independent, and no conflict of interest has arisen as a result of the work performed by Pearl Meyer or Semler Brossy during fiscal year 2020.2023.
The Compensation Committee intends to reassess the independence of its advisers at least annually.
Assessing Compensation Competitiveness
The Compensation and Management Development Committee uses a combination of published and proprietary compensation survey data relating to the compensation practices as a reference sourcesources in determining CEO and NEO compensation.
In connection with its engagement with Pearl MeyerSemler Brossy in 2019,2022, the Compensation and Management Development Committee directed Pearl MeyerSemler Brossy to develop a compensation peer group to assist in developing a compensation program for all our NEOs for 2020. Pearl Meyer provided the Compensation Committee with a recommended list of peer2023. Semler Brossy screened potential comparator companies from the engineering and construction, aerospace and defense, environmental and facilities services and research and consulting services industries that Pearl MeyerSemler Brossy and the Compensation and Management Development Committee determined compete with us for talent as they are in the same or related industries.talent. We also considered the revenue operating income, net income, cash flow and debt to income ratio levelmarket capitalization of these companies and determined that a compensation peer group consisting of companies with levels both above and below our own levels was appropriate. Our Compensation and Management Development Committee believed that including companies with higher revenue and income levels than ours was appropriate due to our historical and recent strong growth.
In July 2019,2022, our Compensation and Management Development Committee reviewed and determined to remove Cubic Corporation from the 2023 peer group as a result of it's acquisition. No other changes were made at the time and the following companies as the peer group to bewere used as a reference source in its 20202023 executive compensation deliberations:
Peer Group for Fiscal Year | ||
AECOM |
Maxar Technologies, Inc | |
Booz Allen Hamilton Holding Corporation | Mercury Systems | |
CACI International Inc |
Corporation | |
Jacobs Solutions Inc |
Stantec, Inc | |
|
| |
|
| |
|
| |
Kratos Defense & Security Solutions, Inc |
| |
Leidos Holdings, Inc | WSP Global, Inc | |
ManTech International Corporation | ||
Our Compensation and Management Development Committee also used published and proprietary compensation survey data provided by Aon Radford, Pearl Meyer, relatingand Willis Towers Watson to analyze the compensation practices of other companies within and outside our industry as a reference source, in addition to other relevant factors, in determining our executives’ compensation. Our Compensation and Management Development Committee applies its independent judgment to make compensation decisions and does not formally benchmark our executive compensation against any particular group of companies or use a formula to set our NEOs’NEOs compensation in relation to this data. Survey data for a revenue range comparable to our companyCompany is utilized, rather than data for specific companies participating in the surveys. Our objective was to obtain data from a broad spectrum of comparable companies for compensation comparison purposes.purposes.
33
Following a review of the peer group by Semler Brossy in July 2023, the Compensation and Management Development Committee determined to remove ManTech International Corporation and Maxar Technologies, Inc as a result of their acquisitions, for 2024 executive compensation deliberations.
Use of Comparative Market Data and Qualitative Factors
Our Compensation and Management Development Committee reviews each component of executive compensation separately and also takes into consideration the value of each NEO’sNEOs’ compensation package as a whole and its relative size in comparison to our other executive officers, with the goal to set all elements of compensation within a competitive range, using a balanced approach that does not use rigid percentiles to target pay levels, but instead makes its compensation decisions based on a variety of relevant factors.
While the Compensation and Management Development Committee believes that information regarding the compensation practices at other companies is useful in assessing the competitiveness, reasonableness and appropriateness of individual executive compensation elements and of our overall executive compensation packages, this information is only one of several factors that our Compensation and Management Development Committee considers. Other factors that are considered include:
Recruitment and retention: The Compensation and Management Development Committee reviews existing NEO compensation and retention levels relative to the competitive labor market pressures and likely estimated replacement cost with respect to the scope, responsibilities and skills required of the particular position.
Lack of directly comparable data for some of our key roles: Compensation data for some of our NEO roles may not be explicitly reported by companies in our compensation peer group
or survey data, or there may not be direct matches for certain roles within our organization. This results in limited sample sizes and/or inconclusive data that can be misleading if targeting a specific percentile for market positioning.
|
Market positioning may be distorted by the source of the data: Certain elements of compensation reported from one source can be consistently higher or lower than the data collected from another, given differences in methods and samples used by each source to collect market data. Given this variability and volatility within the market data, the Compensation and Management Development Committee has determined that targeting pay levels at specific percentiles of this data could result in outcomes that do not align with the internal value and strategic importance of various roles at Parsons.
Relevant Qualitative Factors: A range of subjective and qualitative factors is considered, including:
The role the NEO plays and the importance of such individual’s contributions to our ability to execute on our business strategy and to achieve our strategic objectives;
Each executive officer’s tenure, skills and experience;
The responsibilities and particular nature of the functions performed or managed by the NEO;
Our CEO’s recommendations and hisher assessment of each executive officer’s performance (other than hisher own performance), and with respect to the CEO’s performance, assessment by the Board; and
Internal pay equity across the executive management team.
34
We intend to evaluate our pay philosophy and compensation programs as circumstances require. At a minimum, we will review executive compensation annually. As part of this review process, we expect to apply our values and the objectives outlined above, while considering the compensation levels needed to ensure our executive compensation program remains competitive. We will also review whether we are meeting our pay for performance, key employee retention and other executive compensation program objectives.
Fiscal Year 2020 Compensation2023 Compensation Elements in Detail
Elements at a Glance
The compensation program for our NEOs consists of the following principal components:
Element | Objective | Summary of Key Features | ||||||
Base Salary | Provides competitive fixed compensation levels to attract and retain highly qualified talent | • Base salary increases are tied to market pay references, individual performance in the role, internal pay equity and growth of the Company •
No specific formulas applied | ||||||
Short-Term Annual Incentive: Performance- Based Annual Cash Bonus | Encourages focus on achievement of the Company’s annual financial plan
| • The annual incentive plan awards are at-risk, with earned values depending on the level of performance against financial performance goals year • The 2023 annual incentives were determined based on the following financial performance metrics: revenue (25%), adjusted EBITDA • Range of NEO annual incentive
• Payment may range from 0% to 200% of target based on actual performance |
Long-Term Incentive: Performance- Based | Rewards achievement of performance related to the Company’s long-term objectives and stockholder value creation | • 60% of total long-term incentive target value awarded as PSUs • Performance criteria are 50% based on cumulative within a custom peer benchmark • Payouts may range from 0% to 200% of target based on actual cumulative contract award and |
35
Element | Objective | Summary of Key Features | ||||||
• Three-year cliff vesting at end of performance cycle • The final award payout depends on achievement of the performance criteria and the rTSR modifier at the end of the three years | ||||||||
Long-Term Incentive: Time-Based RSUs | Rewards future performance and supports retention and succession planning | • 40% of total long-term incentive target value awarded takes the form of time-based RSUs • Provides the opportunity to earn a specified number of shares of Parsons common stock subject to the NEO’s continued employment for a specified period • Value of shares ultimately delivered to NEO tied to share price appreciation between grant and delivery date • Three-year ratable vesting period |
Base Salaries
The Compensation and Management Development Committee generally reviews, and adjusts as necessary, base salaries for each of our NEOs annually.annually, or at the time of a promotion or substantial change in responsibilities. In connectiongeneral, base salary increases for seasoned incumbents are generally consistent with the merit pool funded for our year-end financial review processbroader organization. Annual increases that are higher or lower than this range may reflect the individual's competitive positioning to determine 2020 base salaries, our CEO recommended,market, increases or decreases in responsibility or role, and/or other considerations deemed appropriate by the Compensation and our Compensation Committee approved, theManagement Development Committee. In fiscal 2023, base salaries for the NEOs were increased as shown below to maintain competitiveness of our NEOs set forth below. Followingcompensation program. In the reviewcase of Ms. Smith, the larger percentage of increase for fiscal 2023 reflects the Compensation and Management Development Committee's desire to bring Ms. Smith's compensation more in line with the competitive market compensation analysis,following her promotion to CEO in 2021 and based on Ms. Smith's strong performance in the
role.
Named Executive Officer | 2022 Salary | 2023 Salary | Percentage | ||||||||||||
Carey A. Smith |
|
| 900,000 |
|
|
|
| 1,000,000 |
|
|
|
| 11.1 | % |
|
Matthew Ofilos |
|
| 525,000 |
|
|
|
| 543,375 |
|
|
|
| 3.5 | % |
|
Michael R. Kolloway |
|
| 510,000 |
|
|
|
| 517,650 |
|
|
|
| 1.5 | % |
|
Susan M. Balaguer |
|
| 427,500 |
|
|
|
| 448,875 |
|
|
|
| 5.0 | % |
|
Compensation Committee determined our CEO was appropriately positioned and took no action on his base salary.
Named Executive Officer |
| 2018 Salary ($) | 2019 Salary ($) | 2020 Salary ($) | Percentage Increase | ||||||||||||||||
Charles L. Harrington |
|
|
| 1,140,000 |
|
|
|
| 1,140,000 |
|
|
|
| 1,140,000 |
|
|
|
| — |
|
|
Carey A. Smith |
|
|
| 560,000 |
|
|
|
| 640,001 |
|
|
|
| 700,000 |
|
|
|
| 9.4 | % |
|
George L. Ball |
|
|
| 561,502 |
|
|
|
| 580,008 |
|
|
|
| 595,000 |
|
|
|
| 2.6 | % |
|
Michael R. Kolloway |
|
|
| 401,544 |
|
|
|
| 434,998 |
|
|
|
| 475,000 |
|
|
|
| 9.2 | % |
|
Debra A. Fiori |
|
|
| 401,550 |
|
|
|
| 401,550 |
|
|
|
| 420,000 |
|
|
|
| 4.6 | % |
|
Annual Cash Incentives
We provide our NEOs with the opportunity to earn annual cash bonuses to encourage the achievement of corporate objectives and to reward those individuals who significantly impact our corporate results. The Compensation and Management Development Committee determines and approves our annual bonus decisions.
Under the fiscal 20202023 Annual Incentive Plan for Management, or AIP, the annual incentive bonus of each NEO other than the CEO was entirely based on our performance against a mix of corporate financial goals. For our CEO, his annual incentive bonus was based on our performance against the same mix of corporate financial goals as our other NEOs (weighted at 80% of overall target bonus opportunity) and strategic qualitative goals aligned with people, strategy and technology expansion (20% of overall target bonus opportunity).
Commencing in fiscal 2021, our CEO and our other NEOs’ annual bonuses will be based on our performance against financial goals (90% of overall target bonus opportunity) and performance againsta non-financial strategic qualitative goalsgoal (10% of overall target bonus opportunity) set at the beginning of the fiscal year, aligned with diversity, safety, sustainability, quality, integrityenhanced gender and innovation.racial/ethnic diversity.
36
The annual incentive bonus is equal to the product of (1) a dollar amount representing the target amount that the executive officer may be paid as an annual incentive bonus payment (or the “Target Incentive Bonus”), multiplied by (2) a percentage representing the overall achievement of the target levels and their weightings for each of the performance measures for the fiscal year (or the “Performance Goal Achievement”). The Target Incentive Bonus, the performance measures and related target levels and weighting, and the method for determining the Performance Goal Achievement for each executive officer were determined by our Compensation and Management Development Committee, as applicable, after taking into consideration the recommendations of our CEO (for NEOs other than himself)the CEO) at the time the performance measures and related target levels and weightings were determined for the executive officer. No payout would be made for any financial goals that failed to meet the performance threshold. The performance threshold for financial goals was 80% of 80%.target, as described below. Payouts were capped at 200% of target.
For purposes of the fiscal 20202023 AIP, our Compensation and Management Development Committee selected revenue, adjusted EBITDA, revenue andawards, consolidated cash flow and a strategic qualitative goal aligned with enhanced gender and racial/ethnic diversity as the threefive corporate financial performance measures that best supported our annual operating plan, environmental, social and governance initiatives, and enhanced long-term value creation. The addition of the awards goal in fiscal 2023 further emphasizes our focus on long term growth.
Plan Metrics(1) | Metric Type | Weighting for NEOs other than CEO |
| Weighting for CEO |
| ||
Adjusted EBITDA | Corporate | 34% |
| 27.2% |
| ||
|
|
|
|
|
|
|
|
|
|
|
|
|
|
|
|
Revenue | Corporate | 33% |
| 26.4% |
| ||
|
|
|
|
|
|
|
|
Cash Flow | Corporate | 33% |
| 26.4% |
| ||
|
|
|
|
|
|
|
|
Strategic Qualitative | Strategic | 0% |
| 20.0% |
| ||
|
|
|
|
|
|
|
|
|
| Weighting for NEOs |
Revenue | Corporate | 25.0% |
Adjusted EBITDA | Corporate | 25.0% |
Awards | Corporate | 20.0% |
Cash | Corporate | 20.0% |
Diversity | Corporate | 10.0% |
The final performance goal achievement under our AIP for the 20202023 fiscal year for our NEOs other than our CEO was the sum of the performance achievement of each of the three corporate financial goals described above for such fiscal year. The final performance goal achievement under our AIP for our CEO was the sum of the performance achievement of the threefour corporate financial goals described above and the performance achievement of thenon-financial strategic qualitative goals. goal aligned with enhanced gender and racial/ethnic diversity.
The level of achievement of each of the three quantitative performance goals, and in the case of our CEO the strategic qualitativecorporate financial goals was determined as follows:
If the actual goal performance for the fiscal year was | Then the Performance Goal
| ||
Greater than 120% of the target performance goal measure | 200% | ||
Greater than 100% but less than 120% of the target performance goal measure | 100% - 200%* | ||
Equal to the target performance goal measure | 100% | ||
80% or greater but less than 100% of the target performance goal measure | 50% - 100%* | ||
Less than 80% of the target performance goal measure | 0% | ||
*Between these values determined on a straight-line basis | |||
37
For fiscal 2020,2023, the target levels for the threefour corporate financial performance measures are set forth in the table below (in millions). Our Compensation and Management Development Committee believed that achieving the target levels for the threefour corporate financial performance measures would require a focused and consistent effort by our executive officers throughout fiscal 2020.2023. As noted above, we achieved record levels of revenue and adjusted EBITDA in fiscal 2023, and accordingly, the financial metrics were earned at the maximum payout level.
Plan Metrics |
| Metric Type |
| Metric Target (M) |
| Actual Results (M) |
| Performance Goal Achievement (%) |
|
| Metric Type |
| Metric Target (M) |
| Actual Results (M) |
| Performance Goal | |||||||||||||||
Revenue |
|
| Corporate |
|
| $4,475.0 |
|
|
| $5,442.7 |
|
| 200.0% | |||||||||||||||||||
Adjusted EBITDA |
|
| Corporate |
|
| $ | 361.0 |
|
|
|
| $ | 342.6 |
|
|
| 86.9% |
|
|
| Corporate |
|
| $385.0 |
|
|
| $464.7 |
|
| 200.0% | |
Revenue |
|
| Corporate |
|
| $ | 3,984.2 |
|
|
|
| $ | 3,908.9 |
|
|
| 95.3% |
| ||||||||||||||
Awards |
|
| Corporate |
|
| $4,800.0 |
|
|
| $5,996.8 |
|
| 200.0% | |||||||||||||||||||
Cash Flow |
|
| Corporate |
|
| $ | 240.0 |
|
|
|
| $ | 293.5 |
|
|
| 200.0% |
|
|
| Corporate |
|
| $300.0 |
|
|
| $407.7 |
|
| 200.0% | |
|
|
|
|
|
|
|
|
|
|
|
|
|
|
|
|
|
|
|
| |||||||||||||
In early 2020,2023, the Compensation and Management Development Committee established strategic qualitative strategic goals foraligned with enhanced gender and racial/ethnic diversity, which collectively represented 10% of our CEO related to people, strategy and technology expansion, which represented 20% of hisNEOs target annual incentive opportunity for 2020, as2023. Similar to the financial goals described above. above, each of the gender and racial/ethnic diversity goals had threshold, target, and maximum payout opportunities.
In January 2021,February 2024, after its review and evaluation of his performance relative to the qualitativeprogress towards achieving strategic goals aligned with enhanced gender and racial/ethnic diversity, the Compensation and Management Development Committee determined the performancestrategic goal achievement of this goal at 110%,32.1% resulting in a 150%weighted 3.2% achievement factor for this portion of histhe NEOs annual incentive opportunity (150% achievementopportunity.
The strategic goal performance measures are set forth in the table below.
Plan Metric | Metric Type | Metric Measurements | Performance Achievement | ||
Strategic Core Value | Diversity | Improvement of overall representation of diverse (female and race/ethnic) employees assessed against 2023 performance | Improvement in global female representation was achieved below the threshold goal established at the beginning of the year. Improvement in racial/ethnic diversity representation was achieved above the threshold goal, but below the target goal, established at the beginning of the year. Opportunity for sustained measured improvement in female and racial/ethnic diversity representation going forward, particularly as it relates to racial/ethnic diversity within leadership. |
In consideration of both the 20% weighting, resulting in 30% payout), notingfinancial and strategic goal performance, the quick moves to protect employees during the historic pandemic and social unrest while maintaining performance of the corporation; implementing processes to maintain near
plan performance in spite of 5% revenue headwinds from pandemic-induced project deferrals; appointment of four new members of our Board, three of whom were diversity candidates including our President and Chief Operating Officer; the addition of the SVP, Talent Acquisition to the Parsons team to enhance recruiting; improving retention by over 1% year over year; issuance of the company’s first-ever convertible bond note to provide additional liquidity to support strategic investments; closing of a transformative acquisition; launch of new four new products during a work from home operational climate; and a 3.5% increase in technology revenue as a percent of overall revenue, and a 24.8% increase in transactional revenue as a percent of overall revenue.
The overall above target incentive payoutspayout for our NEOs despite the adjusted EBITDA and revenue resulting in 86.9% and 95.3% achievement levels, respectively, was attributed to our cash flow performance and significantly above targeted levels.183.2%.
38
The following table provides information regarding the annual management incentive bonus awards earned by the NEOs for fiscal 2020:2023:
Named Executive Officer |
| Target Bonus (% of Base Salary) |
|
| Target Bonus ($) |
| Financial Performance Achievement (weighted/avg) |
|
| Qualitative Metric Achievement (1) |
|
| Bonus ($) |
|
|
| Target Bonus |
| Target Bonus ($) |
| Financial |
| Bonus ($) |
| ||||||||||
|
|
|
|
|
|
|
|
|
|
|
|
|
|
|
|
|
|
|
|
|
|
|
| |||||||||||
Charles L. Harrington |
| 125% |
|
|
|
| 1,425,000 |
|
|
| 102% |
|
| 30% |
|
| $ | 1,875,000 |
|
| ||||||||||||||
Carey A. Smith |
| 110% |
|
|
|
| 770,000 |
|
|
| 127% |
|
|
| — |
|
| $ | 977,700 |
|
|
| 125% |
| $1,250,000 |
| 183.2% |
| $2,290,200 |
| ||||
George L. Ball |
| 100% |
|
|
|
| 595,000 |
|
|
| 127% |
|
|
| — |
|
| $ | 755,500 |
|
| |||||||||||||
Matthew Ofilos |
| 85% |
| $461,869 |
| 183.2% |
| $846,300 |
| |||||||||||||||||||||||||
Michael R. Kolloway |
| 75% |
|
|
|
| 356,250 |
|
|
| 127% |
|
|
| — |
|
| $ | 452,400 |
|
|
| 75% |
| $388,238 |
| 183.2% |
| $711,400 |
| ||||
Debra A. Fiori |
| 75% |
|
|
|
| 315,000 |
|
|
| 127% |
|
|
| — |
|
| $ | 400,000 |
|
| |||||||||||||
|
|
|
|
|
|
|
|
|
|
|
|
|
|
|
|
|
|
|
|
|
|
|
| |||||||||||
Susan M. Balaguer |
| 75% |
| $336,656 |
| 183.2% |
| $616,900 |
| |||||||||||||||||||||||||
(1) Mr. Harrington’s bonus included strategic qualitative goals, weighted at 20% of his overall bonus target opportunity. The Compensation Committee determined 110% performance of the strategic qualitative goals for Mr. Harrington’s 2020 AIP bonus, resulting in a 150% achievement factor for this portion of his annual bonus.
Long-Term Incentives
We use long-term incentive compensation to motivate and reward our executive officers for long-term corporate performance, thereby aligning the interests of our executive officers with those of our stockholders.
Long-Term Incentives Awarded in 20202023. We awarded the following long-term incentive awards to our NEOs, each of which are described in greater detail below:
Time-based restricted stock units, or RSUs, with three-year ratable vesting.
Performance-based restricted stock units, or PSUs, with three-year cliff vesting.
Our CEO advises the Compensation and Management Development Committee with respect to which NEOs (other than himself)the CEO) should receive long-term incentive awards, and provides information regarding each NEO’s duties, present and potential contributions to the Company and such other factors as the Compensation and Management Development Committee may deem relevant for determining participation in the plans and the size of a NEO’s awards.
Each RSU and PSU represents a contingent right to receive one share of our common stock. Vested shares will be delivered to the recipient following each vesting date. The RSUs and PSUs granted in 20202023 to our NEOs were granted under our 2019 Incentive Award Plan.
In 2020,2023, the targeted values of long-term incentive awards for our NEOs are set forth in the table below. Each NEO’s long-term incentive compensation target for 20202023 was allocated 40% to RSUs and 60% to PSUs (at “target”).
Named Executive |
| PSU Target |
| PSU Target |
| RSU Target |
| RSU Units (#) |
| 2023 Total |
Carey A. Smith (1) |
| 3,210,000 |
| 71,159 |
| 2,140,000 |
| 47,439 |
| 5,350,000 |
Matthew Ofilos |
| 669,000 |
| 14,830 |
| 446,000 |
| 9,886 |
| 1,115,000 |
Michael R. Kolloway |
| 582,000 |
| 12,901 |
| 388,000 |
| 8,601 |
| 970,000 |
Susan M. Balaguer |
| 270,000 |
| 5,985 |
| 180,000 |
| 3,990 |
| 450,000 |
Named Executive Officer |
| PSU Target Award ($) |
|
| PSU Target Units (#) |
|
| RSU Target Award ($) |
|
| RSU Units (#) |
|
| 2020 Total Long-Term Incentive Target Award ($) |
| |||||
Charles L. Harrington |
|
| 3,270,000 |
|
|
| 78,285 |
|
|
| 2,180,000 |
|
|
| 52,190 |
|
|
| 5,450,000 |
|
Carey A. Smith(1) |
|
| 918,000 |
|
|
| 21,977 |
|
|
| 612,000 |
|
|
| 14,651 |
|
|
| 1,530,000 |
|
George L. Ball |
|
| 589,200 |
|
|
| 14,105 |
|
|
| 392,800 |
|
|
| 9,403 |
|
|
| 982,000 |
|
Michael R. Kolloway |
|
| 399,000 |
|
|
| 9,552 |
|
|
| 266,000 |
|
|
| 6,368 |
|
|
| 665,000 |
|
Debra A. Fiori |
|
| 315,000 |
|
|
| 7,541 |
|
|
| 210,000 |
|
|
| 5,027 |
|
|
| 525,000 |
|
|
|
|
|
|
|
|
|
|
|
|
|
|
|
|
|
|
|
|
|
|
(1) In addition to the awards included in this table, in January 2020, Ms. Smith wasreceived a one-time equity award. The one-time equity award package of RSUs and PSUs awarded 35,000 RSUs,December 2023 is not included, as discusseddescribed below.
39
The RSUs granted to the NEOs in 20202023 vest in three equal installments on each of March 4, 2021, 2022February 26, 2024, 2025 and 2023,2026 (other than the CEO's one time performance grant which vests over four equal installments beginning December 18, 2023), subject to the NEO’s continued service with the Company through each such vesting date, except as provided in the 2019 Incentive Award Plan or the applicable award agreement.
In the case of a NEOs termination of service due to death or disability, a NEO will vest in a prorated portion of the RSUs scheduled to vest on the next annual vesting date, based on the portion of the calendar yearmonths that has elapsed since the previous annual vesting date (or if no annual vesting date has yet occurred, since the Grant Date) through the date of termination. ProratedIn the event of Participant’s Termination of Service due to Retirement, Participant will immediately vest upon such Termination of Service in the total number of RSUs set forth in the Grant Notice.
All of our NEOs change in control requires a double trigger for accelerated vesting upon retirement will be within the discretion of the Compensation Committee.equity. In addition, in the event of a changeChange in control, providedControl where a Qualifying Termination Event occurs, the NEO has not experienced a termination of service prior to the change in control, all of theNEOs RSUs willshall accelerate, vest and be settled in shares of our common stockfull immediately prior to such changeChange in control.Control.
In January 2020, the Compensation Committee approved a one-time award of 35,000 RSUs for Ms. Smith, in recognition of her outstanding performance managing the operations of the entire Parsons portfolio. These RSUs vest on December 31, 2021, subject to her continued service with the company through such vesting date and are eligible for the same accelerated vesting as the other RSUs granted to our NEOs described above.
The PSUs granted in 20202023 are earned upon the achievement of pre-established performance goals over a three-year performance cycle. Each year our Board approves the applicable performance criteria, including the level(s) of performance, upon which the PSUs payable will be determined in respect of a NEO’s PSU target award. The performance goals may be expressed in terms of overall Company financial results on an absolute or relative basis, such as, but not limited to, its results in relation to a budgeted target or industry benchmarks. The pre-established thresholds, targets, and maximums for these performance goals are not disclosed for competitive reasons. At the end of a performance cycle, the Compensation and Management Development Committee determines actual performance against the applicable performance goals and the resulting number of PSUs actually earned by a NEO. A NEO’s PSU target dollar value is converted into a number of PSUs on the date of grant based on the trailing 60-trading day weighted average up to and including the grant date.
The three-year performance cycle for the PSUs granted in 20202023 commenced on January 1, 20202023, and will end on December 31, 2022.2025. These PSUs are referred to as the “2020-2022“2023-2025 PSUs.” The performance goals for the 2020-20222023-2025 PSUs were divided equally between cumulative contract award values and adjusted EBITDA margin,and cumulative revenue, which the Compensation and Management Development Committee believed to be important metrics for driving performance and promoting alignment of the interests of our executive officers and our stockholders. The targets set for the 2020-20222023-2025 PSU performance goals were determined
based on the Company’s business plan and are designed to be challenging yet attainable, with the opportunity for a maximum payout of 200% of the target PSUs in connection with performance achievement of 116%115% of target, or greater, for cumulative contract awards,Adjusted EBITDA, and 113%115% of target, or greater, for adjusted EBITDA margin.cumulative revenue. Target performance relative to the performance goals will result in 100% of the PSUs vesting. Parsons must achieve threshold performance (90% of target for cumulative contract awardsadjusted EBITDA and 90% of target for adjusted EBITDA margin)cumulative revenue for at least one of these two financial metrics for any PSUs to vest.
40
The resulting number of PSUs after determining performance relative to the cumulative contract awards and adjusted EBITDA marginand cumulative revenue that would be eligible to vest will then be multiplied by a multiplier (the "rTSR Multiplier") determined based on the Company's relative total stockholdershareholder return ("rTSR") percentile ranking within the custom “Peer Benchmark” (as defined below) for the 2020-20222023-2025 Performance Cycle as follows:
rTSR Performance for the | rTSR Multiplier | |
Company rTSR ranking of 75th percentile or above | 125% | |
Company rTSR ranking of 50th percentile | 100% | |
Company rTSR ranking of 25th percentile or below | 75% |
rTSR achievement between threshold and target and between target and maximum will be calculated as an interpolation between the potential payment results.
The "Peer Benchmark" includes AECOM, Booz Allen Hamilton Holding Corporation, CACI International Inc, Jacobs Engineering GroupSolutions Inc, Leidos Holding, Inc, ManTech International Corporation, Science Applications International Corporation, Stantec Inc, Tetra Tech Inc, and WSP Global Inc. The Peer Benchmark represents peers we benchmark financial performance against and is generally in line with most analysts’ models, which the Compensation and Management Development Committee believed to be appropriate for purposes of computing relative TSR.rTSR.
The 60-trading day weighted average stock price preceding (and including) the first day and last day of the 2020-20222023-2025 performance cycle will be used to determine the company'sCompany's rTSR relative to the Peer Benchmark Group.Benchmark.
Following the completion of the three-year performance cycle, the Compensation and Management Development Committee will determine the achievement percentage relative to the performance goals and rTSR for the performance cycle and determine the final achievement percentage for the PSUs. Except as provided in the 2019 Incentive Award Plan or the applicable award agreement, a recipient must be employed on the date of payout in order to be eligible to vest in the PSUs.
In the event of a NEO’s termination of service due to retirement, defined as age 62 with 10 years of service, death or disability prior to the payment date and prior to the occurrence of a change in control,Payment Date, the NEO will remain eligible to vest in and receive a prorated portion of his or her PSUs for the portion of the three-year performance cycle that has elapsed prior to the date of the termination based on actual performance for the three-year cycle, with the PSUs vesting upon Compensation and Management Development Committee certification of performance following the performance cycle (or, if earlier, the date of a change in control).
All of our NEOs change in control requires a double trigger for accelerated vesting of equity. The PSUs shall continue to be eligible for accelerated vesting provided that in the event of the NEOs Termination of Service without "cause" (and other than as a result of NEOs retirement, death or disability) upon or within twelve (12) months following the Change in Control, provided such termination occurs prior to the Payment Date, the NEO will vest in the Target PSUs on the date of such termination. In the event of a changeChange in controlControl prior to the end of the performance cycle, providedPayment Date, where the NEO has not experienced a termination of service prior toQualifying Termination Event, the change in control, a number of PSUs equal to the targetTarget PSUs shall accelerate, vest and be settled in shares of our common stockfull immediately prior to such changeChange in control.Control.
41
One-Time CEO Award
Long-Term IncentiveAs discussed above, Parsons achieved record revenue and adjusted EBITDA levels in fiscal 2023 under the leadership of Ms. Smith. Ms. Smith was individually recognized with numerous leadership accolades, including being named “Executive of the Year” at the Greater Washington Government Contractor Awards, Prior to IPO; Vestingpresented by the Northern Virginia Chamber of 2018-2020 Long-Term Incentive Awards
Prior to our IPO, we maintained three long-term incentive compensation plans in which our NEOs participated - the Long-Term Growth Plan (“LTGP”), the Shareholder Value Plan (“SVP”),Commerce and the Restricted Award Unit (“RAU”Professional Services Council. Furthermore, under Ms. Smith’s leadership, the company was also recognized for excellence in culture, execution, and ethical business practices, including being named one of the World’s Most Ethical Companies by Ethisphere for the 14th consecutive year and placing as one of Engineering News-Record’s top three companies in four categories: program management, construction management, professional services, and program/construction for fee. The company also was recognized as a leading employer for workplace excellence by the Los Angeles Business Journal, The Colorado Springs Gazette, Minority Engineer Magazine, STEM Workforce Diversity Magazine, the Human Rights Campaign Foundation, Forbes Magazine, Newsweek, the Washington Business Journal, and Woman Engineer Magazine.
After considering Ms. Smith’s performance as CEO, her unvested equity holdings, and the competitive market for CEO pay in our sector, the Compensation and Management Development Committee approved a one-time equity award package for Ms. Smith with a total target value of $10,000,000 in December 2023
A majority of the package was delivered in performance-based equity (60%) Plan - eachthat cliff vests after a four-year performance period. The remaining portion of whichthe award was delivered in time-based equity (40%) and vests in equal annual installments over four years. The four year vesting horizons in both the performance-based and time-based portion of the award are describedlonger than the three year-horizon used in greater detail below. Long-term incentive awards granted under these plans priorour annual equity program. The design of the one-time equity award package was driven by the Committee's objective to 2019 were grantedrecognize and reward Ms. Smith's strong leadership and performance as our CEO, motivate Ms. Smith's future performance in a manner that is aligned with stockholder interests, and promote Ms. Smith’s ongoing retention.
The one-time PSU award shall vest based on relative TSR performance during the four-year period commencing December 18, 2023 and ending December 17, 2027 (the "2023-2027 Performance Cycle") and subject to Ms. Smith’s ongoing service through such period. The Company must achieve a threshold level of relative TSR performance for Ms. Smith to receive any payment with respect to the award. In recognition of the “above-and-beyond” nature of the award, and to further incentivize exceptional performance over the coming years, the Company must achieve at least the 65th percentile of relative performance for the target number of shares to be earned. The target PSUs set forth in the form of phantom units that are settled in cash. Commencing in 2019, awards granted under the LTGP and RAU plans are settled in shares. We refer to the 2019 awards under our LTGP and RAU Plan as RSUs and PSUs, as theygrant will be settledmultiplied by a rTSR Multiplier determined based on the rTSR percentile ranking within the Peer Benchmark for the 2023-2027 Performance Cycle as follows:
rTSR Performance for the 2023-2027 Performance Cycle | rTSR Multiplier | |
Company rTSR ranking of 75th percentile or above | 150% | |
Company rTSR ranking of 65th percentile | 100% | |
Company rTSR ranking of 55th percentile | 50% | |
Company rTSR ranking of 35th percentile or below | 0% |
rTSR achievement between the various thresholds noted in shares. We did not issue any SVP awards in 2019.
Each NEO’s long-term incentive compensation target was historically equally divided across these three plansthe table above will be linearly interpolated. The 60-trading day weighted average stock price preceding (and including) the first day and last day of the 2023-2027 performance cycle will be used to determine the total shareholder return for Parsons and the awards under each plan have three-year cliff vesting. Additionally, except inPeer Benchmark constituent companies.
42
In the caseevent of Ms. Smith's Termination of Service due to death, disability, or retirement, as described above and below,Ms. Smith's Termination of Service due to involuntary Termination of Service by the Company for any reason other than performance or cause, Ms. Smith will vest in a NEO must remain employed throughprorated portion of the PSUs scheduled to vest on the vesting date, in order to receive payment on an award. The value of each of the awards under our legacy long-term incentive plans is linked to the value of our common stock, thereby supporting our pay-for performance philosophy and retention efforts.
LTGP. The LTGP provides an opportunity for the NEOs to earn a cash payment based on a number of phantom stock units that are earned upon the achievement of pre-established performance goals. Each phantom stock unit has the equivalent value of one share of our common stock. Our LTGP, therefore is similar to a cash-settled PSU.
Each year our Board approved the applicable performance criteria, including the level(s) of performance, upon which the potential amount(s) payable will be determined in respect of a NEO’s “Long Term Growth Opportunity Target”. A NEO’s “Long Term Growth Opportunity Target” is the target dollar value of the incentive which could potentially be earned by a NEO in respect of a performance cycle. The target is expressed in U.S. dollars which are converted into phantom stock units based on our then-current share price at the beginning of the performance cycle. The performance goals may be expressed in terms of overall Company financial results on an absolute or relative basis, such as, but not limited to, its results in relation to a budgeted target or industry benchmarks.
At the end of a performance cycle, the Compensation Committee determines actual performance against the applicable performance goals and the resulting number of phantom stock units actually earned by a NEO. The earned phantom stock units are then paid in cash based on the valueportion of our common stock atmonths that has elapsed since the endgrant date through the date of termination. In the event of Ms. Smith’s Termination of Service due to Retirement, Ms. Smith will forfeit upon such Termination of Service the total number of PSUs set forth in the Grant Notice unvested as of the Termination date.
Subject to Ms. Smith’s ongoing service, the RSU component of the one-time award will vest in four equal installments on each anniversary of grant. In the event of Ms. Smith’s Termination of Service due to death or disability, Ms. Smith will vest in a prorated portion of the RSUs scheduled to vest on the next annual vesting date, based on the portion of months that has elapsed since the previous annual vesting date (or if no annual vesting date has yet occurred, since the Grant Date) through the date of termination. In the event of Ms. Smith's Termination of Service due to involuntary Termination of Service by the Company for any reason other than performance cycle.or cause, Ms. Smith will immediately vest upon such Termination of Service in the total number of RSUs set forth in the Grant Notice. In the event of Ms. Smith's Termination of Service due to Retirement, Ms. Smith will forfeit upon such Termination of Service the total number of RSUs set forth in the Grant Notice unvested as of the Termination date.
Vesting of 2021-2023 Long-Term Incentive Awards
The 2018-20202021-2023 performance cycle performance goals were divided equally between cumulative contract award values and NOI margin,cumulative adjusted EBITDA Margin, which the Compensation and Management Development Committee believed to be important metrics for driving performance and promoting alignment of the interests of our executive officers and our stockholders. The targets set for 2018-20202021-2023 performance goals were determined based on the business plan, and were designed to be challenging yet attainable, with the opportunity for a maximum payout of 150%200% of the target unitsPSUs in connection with performance achievement of 120%,115% of target, or greater, for cumulative contract awards, and 115% of target, or greater, for adjusted EBITDA margin. Target performance relative to the performance goals was set to result in 100% of the performance goal target.PSUs vesting. Parsons musthad to achieve threshold performance (90% of 80%target for cumulative contract awards and 90% of target for cumulative adjusted EBITDA margin) for at least one of these two financial metrics for any amountPSUs to be paid undervest. The resulting number of PSUs from the LTGP. Outstanding LTGP awards were generally eligiblecumulative contract award and cumulative adjusted EBITDA achievement was then modified by a rTSR Multiplier determined based on the Company's "rTSR" percentile ranking within the Peer Benchmark (as described above) for the same accelerated vesting terms2021-2023 performance cycle, with the opportunity for a maximum multiplier of 125% of the initial eligible PSUs in connection with the Company’s rTSR ranking of 75th percentile or above, a target multiplier of 100% in connection with a ranking of 50th percentile, and a multiplier of 75% in connection with a ranking of 25th percentile or below. Achievement between threshold and target and between target and maximum was calculated as described above for the 2020-2022 PSUs.an interpolation between potential payout results.
43
At least threshold performance of 80% was required for at least one of these two financial metrics for any amount to be paid under the LTGP.PSUs. At threshold performance the NEO earned 50% of his or her phantom unitPSU award, 100% at target performance and 150%200% upon achievement of the maximum goal. The threshold, target and maximum goals for the 2018-20202021-2023 cycle were:
Cumulative Contract Awards ($ billions) |
| Potential Payout %* |
<$10.40 |
| 0 |
$10.40 |
| 50% |
$11.70 |
| 75% |
$13.00 |
| 100% |
$14.30 |
| 125% |
≥$15.60 |
| 150% |
*Between these values determined on a straight-line basis | ||
Cumulative Contract Awards ($ billions) |
| Potential Payout %* |
<$13.75 |
| 0 |
$13.75 |
| 50% |
$14.52 |
| 75% |
$15.30 |
| 100% |
$15.86 |
| 125% |
$16.43 |
| 150% |
$17.00 |
| 175% |
≥$17.57 |
| 200% |
*Between these values determined on a straight-line basis | ||
Results between threshold and target and target and maximum are determined by straight line interpolation, but a steeper curve was applied to performance between target and maximum.interpolation.
NOI Margin |
|
| Potential Payout %* |
| |
<6.7% |
|
|
| 0 |
|
6.7% |
|
| 50% |
| |
7.1% |
|
| 75% |
| |
7.5% |
|
| 100% |
| |
7.8% |
|
| 125% |
| |
>8.2% |
|
| 150% |
| |
*Between these values determined on a straight-line basis |
| ||||
Adjusted EBITDA Margin |
| Potential Payout %* |
<8.5% |
| 0 |
8.5% |
| 50% |
9.0% |
| 75% |
9.4% |
| 100% |
9.8% |
| 125% |
10.1% |
| 150% |
10.5% |
| 175% |
>10.8% |
| 200% |
*Between these values determined on a straight-line basis | ||
For the 2018-20202021-2023 performance cycle, in March 2021,February 2024, the Compensation and Management Development Committee determined that our cumulative contract awards was $12.839$17.1 billion and our NOIcumulative adjusted EBITDA margin was 7.2%8.5%, resulting in a weighted average performance achievement for the total initial eligible PSU achievement at 116.6%. The 2021-2023 rTSR percentile rank was determined to be 66.7% resulting in rTSR multiplier of 89.08%116.7%, for a resulting total payout of the target awards.136.04%. The 2018-2020 LTGP2021-2023 PSU awards will be paid in cashshares to the NEOs in March 2021.February 2024. For information about the 2018-2020 LTGP2021-2023 PSU awards held by each of our NEOs, see the “Outstanding Long-Term Incentive Awards at Fiscal Year-End Table” below.
SVP. The SVP provided a cash incentive based on the increase in our share price over a three-year period, multiplied by a number of phantom share units. If at the end of a performance cycle our share price had not increased, then no SVP incentive award payment was earned. Each SVP award acted similar to a time vested cash-settled stock appreciation right. All outstanding SVP awards were vested as of December 31, 2020.
RAU Plan. The RAU Plan provided the opportunity to earn a cash payment based on the value of a specified number of phantom stock units subject to the executive officer’s continued employment for a specified period. Each RAU award was similar to cash-settled time vested restricted stock unit. All outstanding RAU awards were vested as of December 31, 2020.
The value of the 2018-2020 awards, for the purposes of the determining the cash payment, is based on trailing 60-trading day weighted average up to and including the vesting date.
Other Compensation Elements
We also provide our employees, including our NEOs, with a variety of employee benefit plans, including our ESOP, a 401(k) plan with matching contributions, non-qualified deferred compensation
plans and welfare benefits, such as health, life and disability, which we use to attract and retain our employees.
We also offer financial planning and executive physical reimbursements to our NEOs to the extent our Board believes that these limited perquisites are appropriate to assist an individual NEO in the performance of his or her duties, to make our NEOs more efficient and effective, and for recruitment, motivation or retention purposes.
All future practices with respect to perquisites or other personal benefits will continue to be subject to periodic review and approval by the Compensation and Management Development Committee.
Post-Employment Compensation
The initial terms and conditions of employment for each of our NEOs are set forth in written offer letters. Each of our NEOs are employed on an at-will basis.
We have offered each NEO certain protection in the event of their termination of employment under specified circumstances following a change in control of our company. We believe that these protections serve our executive retention objectives by ensuring that we will have continued dedication of the NEO and the availability of his or her advice and counsel, and, with respect to the post-change in control separation benefits, to induce the NEOs to remain in our employ in the face of a potential change in control. The terms of these arrangements were determined by the Compensation Committee.
For a summary of the material terms and conditions of our post-employment compensation arrangements, see “—Potential Payments upon Termination or Change in Control” below.
Our Compensation Clawback Policy that applies to our NEOs. Pursuant to this policy, the Compensation and Management Development Committee has the authority to seek:
Compensation paid, payable or awarded under the Company’s short- and long-term incentive compensation programs, including any discretionary bonuses, equity-based incentive awards (whether or not vested).
Shares or phantom units acquired upon vesting or lapse of restriction of any awards; shares or phantom units acquired upon exercise of options or appreciation rights; dividend equivalents paid on equity incentive awards.
Cash incentives.
In the event of:
If the Company suffers, or could reasonably be expected to suffer, material financial damage as a result of any conduct by the NEO constituting fraud, material theft of Company assets, bribery, corruption, or other illegal acts, gross negligence, or willful misconduct involving the Company or its subsidiaries (“Detrimental Conduct’’).
A material restatement of the Company’s financial or operational results, as a result of the NEO’s Detrimental Conduct, but not including restatements caused by changes in accounting rules, reclassifications or similar retrospective changes that are not the result of Detrimental Conduct (a “Restatement”).
The Compensation and Management Development Committee may recover under this policy the incentive compensation paid, awarded or acquired by the NEO within the three years preceding the date on which the Compensation and Management Development Committee determines circumstances triggering the right to clawback such compensation has occurred. Additionally, in the event of a Restatement,restatement, the amount that may be recovered under this policy will be limited to the excess of the amount of any incentive compensation actually paid, vested or awarded, and the amount of any such incentive compensation that would have been paid, vested or awarded had the financial or operational results been properly reported.
Any clawback under this policy may, in the discretion of the Compensation and Management Development Committee, be accomplished through (1) the reduction, forfeiture or cancellation of awards whether or not vested or deferred, (2) requiring the repayment to the Company of any gain realized or payment received upon the exercise or payment of the award valued as of the date of exercise or payment, (3) adjusting future incentive compensation opportunities, or (4) such other manner as the Compensation and Management Development Committee, in its discretion, determines to be appropriate.
The Company’s right of clawback under this Policy is in addition to any other remedy available to it, including, but not limited to, termination of employment, the initiation of civil or criminal proceedings, and any right to repayment under the Sarbanes-Oxley Act of 2002, and any other applicable law.
45
Additionally, in October 2023, the Company adopted Parsons Dodd-Frank Compliant Compensation Clawback Policy as required by the final Dodd-Frank rules and exchange listing standards. Our policy requires recoupment of incentive compensation erroneously paid to our executive officers if amounts were based on material noncompliance with any financial reporting requirement that causes an accounting restatement, without regard to any fault or misconduct.
Executive Ownership Guidelines
We adopted stock ownership guidelines in January 2020, as theThe Board believes that it is important to link the interests of our NEOs to those of our stockholders. The stock ownership guidelines require our executives to accumulate and hold a minimum number of shares of Parsons common stock within five years of the later of (1) the effective date of the policy or (2) the date of appointment/promotion of the executive officer. The specific Parsons stock ownership requirements for our executive officers are as follows:
CEO |
| |
Other Executive Officers |
| |
For our CEO and other executive officers, shares of our common stock that count towards satisfaction of these guidelines include (1) common stock directly owned by the executive or immediate family member (2) common stock owned indirectly if the individual has an economic interest in the shares (beneficial ownership as defined in Rule 13d-3 and reported in the proxy) (3) shares held through the ESOP, (4) unvested restricted stock or RSUs, excluding shares or units remaining subject to achievement of performance goals, and (5) shares held through the 401(k) plan, at such time in the future this option is available.
Value of ownership is measured by reference to the trailing 60 trading day weighted average of the Parsons common stock, up to and including last day of the calendar year; compliance is evaluated annually.
As of December 31, 2020,2023, each of our continuing NEOs is in compliance with their ownership guideline, either by meeting their executive ownership requirement, or by having made sufficient progress toward their ownership requirement based on time in role.
Anti-Hedging and Anti-Pledging Policies
Under our Insider Trading Compliance Policy, we prohibit our employees, including our NEOs, and Board members, from hedging the risk associated with ownership of shares of Parsons common stock and other securities, as well as from pledging any Parsons securities as collateral for a loan.
Our Compensation and Management Development Committee is responsible for the oversight of our risk profile, including compensation-related risks. Our Compensation and Management Development Committee monitors our compensation policies and practices as applied to our employees to ensure that these policies and practices do not encourage excessive and unnecessary risk-taking, and that the level of risk that they do encourage is not reasonably likely to have a material adverse effect on us. The compensation policies and practices in place that mitigate unnecessary risk include:
An appropriate compensation mix that is designed to balance fixed and variable pay and emphasize both short-term and long-term performance.
A substantial portion of incentive compensation for top level executives is associated with our long-term performance. This discourages short-term risk taking.
46
Financial performance measures used for incentive plans covering colleagues at all levels of the Company include a balanced mix of financial metrics that are in-line with operating and strategic plans.
Different performance measures are used in ourCertain, but not all, of the short- and long-term incentive plans,metrics overlap; where applicable, different measurement periods are used (i.e., 1- and 3-years), which provides a balance and reduces the opportunity to take undue risks to meet a single goal.
A significant portion of annual and long-term incentive payments are based on Company and business profitability, ensuring a correlation between pay and performance.
Financial targets are appropriately set, and if not achieved, result in a reduction of compensation. Assuming at least threshold performance is achieved, our incentive plans generally result in some payouts at levels below target, rather than an “all-or-nothing” approach.
Executive and broad-based incentive plans cap the maximum award payable to any individual.
The Compensation and Management Development Committee considers information from peer group companies to provide a reference for compensation design, thereby avoiding unusually high pay opportunities relative to the company’sCompany’s peers.
Incentive payments are subject to clawback in the event of certain conduct and/or conduct causingthe result of a material restatement of our financial results.
As part of its role, the Compensation and Management Development Committee reviews and considers the deductibility of our executive compensation under Section 162(m) of the Internal Revenue Code. Section 162(m) generally limits the tax deduction for compensation in excess of one million dollars paid to certain executive officers. The Compensation and Management Development Committee does not necessarily limit executive compensation to the amount deductible under that provision.
In its review and establishment of compensation programs and awards for our NEOs, the Compensation and Management Development Committee considers the anticipated deductibility or non-deductibility of the compensation as only one factor in assessing whether a particular compensatory arrangement is appropriate, particularly in light of the goals of maintaining a competitive executive compensation system generally (i.e., paying for performance and maximizing stockholder return).
The Compensation and Management Development Committee reserves the right to use their judgment to authorize compensation payments that do not qualify for the compensation deduction if, in light of all applicable circumstances, they believe that such payments are appropriate and in the Company’s best interests and that of our stockholders.
47
In designing and implementing our compensation programs the Compensation and Management Development Committee also takes into account the accounting impact of such payments. However, it ultimately determines pay based on the most effective means to implement our long-term strategy.
COMPENSATION AND MANAGEMENT DEVELOPMENT COMMITTEE REPORT ON EXECUTIVE
COMPENSATION
The Compensation and Management Development Committee has reviewed and discussed the CD&A included in this proxy statement with members of management, and based on such review and discussions, the Compensation and Management Development Committee recommended to the Board that the CD&A be included in this proxy statement.
THE COMPENSATION AND MANAGEMENT DEVELOPMENT COMMITTEE | |
Mark K. Holdsworth Steven F. Leer (Chair) Ellen M. Lord | |
Gen. Darren W. McDew, USAF (ret.) | |
Harry T. McMahon | |
David C. Wajsgras |
48
COMPENSATION TABLES
The following table presents summary information regarding the total compensation awarded to, earned by, or paid to each of our NEOs for services rendered in all capacities for fiscal 2020.2023.
SUMMARY COMPENSATION TABLE | |||||||||||||||||||||||||
Name and Principal | Year | Salary | Stock | Non-Equity | Change in | All Other | Total | ||||||||||||||||||
Carey A. Smith | 2023 |
| 976,923 |
|
|
| 15,215,909 |
|
|
| 2,290,200 |
|
|
| 18,822 |
|
|
| 95,041 |
|
| $ | 18,596,895 |
|
|
Chair, President & | 2022 |
| 899,999 |
|
|
| 4,730,700 |
|
|
| 1,237,200 |
|
|
| 8,192 |
|
|
| 97,714 |
|
| $ | 6,973,806 |
|
|
Chief Executive Officer | 2021 |
| 798,557 |
|
|
| 3,895,113 |
|
|
| 569,100 |
|
|
| 4,238 |
|
|
| 81,110 |
|
| $ | 5,348,118 |
|
|
Matthew Ofilos | 2023 |
| 535,601 |
|
|
| 1,151,618 |
|
|
| 846,300 |
|
|
| 832 |
|
|
| 53,068 |
|
| $ | 2,587,420 |
|
|
Chief Financial Officer | 2022 |
| 432,692 |
|
|
| 1,671,553 |
|
|
| 397,100 |
|
|
| — |
|
|
| 44,047 |
|
| $ | 2,545,391 |
|
|
|
|
|
|
|
|
|
|
|
|
|
|
|
|
|
|
|
|
| |||||||
Michael R. Kolloway | 2023 |
| 514,413 |
|
|
| 1,001,864 |
|
|
| 711,400 |
|
|
| 8,330 |
|
|
| 78,503 |
|
| $ | 2,314,509 |
|
|
Chief Legal Officer & | 2022 |
| 505,769 |
|
|
| 901,036 |
|
|
| 420,700 |
|
|
| 3,851 |
|
|
| 78,827 |
|
| $ | 1,910,184 |
|
|
Secretary | 2021 |
| 489,423 |
|
|
| 765,313 |
|
|
| 201,700 |
|
|
| 2,090 |
|
|
| 77,136 |
|
| $ | 1,535,662 |
|
|
Susan M. Balaguer | 2023 |
| 439,832 |
|
|
| 464,775 |
|
|
| 616,900 |
|
|
| 764 |
|
|
| 57,547 |
|
| $ | 1,579,817 |
|
|
Chief Human Resources Officer | 2022 |
| 422,212 |
|
|
| 981,197 |
|
|
| 352,600 |
|
|
| — |
|
|
| 46,887 |
|
| $ | 1,802,895 |
| |
|
|
|
|
|
|
|
|
|
|
|
|
|
|
|
|
|
|
| |||||||
SUMMARY COMPENSATION TABLE | |||||||||||||||||||||||||||||||||||||||||||||
Name and Principal Position | Year |
| Salary ($) |
| Stock Awards ($)(1) |
| SVP Awards ($)(2) |
| Non-Equity Incentive Plan Compensation ($)(3) |
| Change in Pension Value and Nonqualified Deferred Compensation Earnings ($)(4) |
| All Other Compensation ($)(5) |
| Total ($) | ||||||||||||||||||||||||||||||
Charles L. Harrington |
| 2020 |
|
|
|
| 1,140,001 |
|
|
|
|
| 4,974,490 |
|
|
|
|
| — |
|
|
|
|
| 1,875,000 |
|
|
|
|
| 102,654 |
|
|
|
|
| 139,814 |
|
|
|
| $ | 8,231,959 |
|
|
Chief Executive |
| 2019 |
|
|
|
| 1,140,001 |
|
|
|
|
| 4,512,024 |
|
|
|
|
| — |
|
|
|
|
| 1,169,100 |
|
|
|
|
| 788,762 |
|
|
|
|
| 132,147 |
|
|
|
| $ | 7,742,034 |
|
|
Officer |
| 2018 |
|
|
|
| 1,133,396 |
|
|
|
|
| 3,000,000 |
|
|
|
|
| 1,500,000 |
|
|
|
|
| 1,455,500 |
|
|
|
|
| 184,102 |
|
|
|
|
| 563,382 |
|
|
|
| $ | 7,836,380 |
|
|
Carey A. Smith |
| 2020 |
|
|
|
| 694,230 |
|
|
|
|
| 2,905,329 |
|
|
|
|
| — |
|
|
|
|
| 977,700 |
|
|
|
|
| 3,403 |
|
|
|
|
| 70,076 |
|
|
|
| $ | 4,650,738 |
|
|
President & Chief |
| 2019 |
|
|
|
| 614,390 |
|
|
|
|
| 940,010 |
|
|
|
|
| — |
|
|
|
|
| 481,400 |
|
|
|
|
| 21,233 |
|
|
|
|
| 76,050 |
|
|
|
| $ | 2,133,083 |
|
|
Operating Officer |
| 2018 |
|
|
|
| 457,793 |
|
|
|
|
| 556,200 |
|
|
|
|
| 278,100 |
|
|
|
|
| 579,300 |
|
|
|
|
| 19,326 |
|
|
|
|
| 33,630 |
|
|
|
| $ | 1,924,349 |
|
|
George L Ball |
| 2020 |
|
|
|
| 588,658 |
|
|
|
|
| 896,266 |
|
|
|
|
| — |
|
|
|
|
| 755,500 |
|
|
|
|
| 76,219 |
|
|
|
|
| 67,052 |
|
|
|
| $ | 2,383,695 |
|
|
Chief Financial |
| 2019 |
|
|
|
| 572,890 |
|
|
|
|
| 846,000 |
|
|
|
|
| — |
|
|
|
|
| 396,600 |
|
|
|
|
| 315,905 |
|
|
|
|
| 71,629 |
|
|
|
| $ | 2,203,024 |
|
|
Officer |
| 2018 |
|
|
|
| 554,521 |
|
|
|
|
| 580,000 |
|
|
|
|
| 290,000 |
|
|
|
|
| 498,700 |
|
|
|
|
| 112,069 |
|
|
|
|
| 148,237 |
|
|
|
| $ | 2,183,527 |
|
|
Michael R. Kolloway |
| 2020 |
|
|
|
| 458,076 |
|
|
|
|
| 606,966 |
|
|
|
|
| — |
|
|
|
|
| 452,400 |
|
|
|
|
| 1,764 |
|
|
|
|
| 131,935 |
|
|
|
|
| 1,651,141 |
|
|
Chief Legal Officer |
| 2019 |
|
|
|
| 422,133 |
|
|
|
|
| 408,924 |
|
|
|
|
| — |
|
|
|
|
| 223,100 |
|
|
|
|
| 12,549 |
|
|
|
|
| 105,327 |
|
|
|
| $ | 1,172,033 |
|
|
|
| 2018 |
|
|
|
| 396,662 |
|
|
|
|
| 267,734 |
|
|
|
|
| 133,867 |
|
|
|
|
| 267,500 |
|
|
|
|
| 12,709 |
|
|
|
|
| 171,588 |
|
|
|
| $ | 1,250,060 |
|
|
Debra A. Fiori |
| 2020 |
|
|
|
| 412,194 |
|
|
|
|
| 479,168 |
|
|
|
|
| — |
|
|
|
|
| 400,000 |
|
|
|
|
| 2,331 |
|
|
|
|
| 52,461 |
|
|
|
| $ | 1,346,154 |
|
|
Chief People |
|
|
|
|
|
|
|
|
|
|
|
|
|
|
|
|
|
|
|
|
|
|
|
|
|
|
|
|
|
|
|
|
|
|
|
|
|
|
|
|
|
|
|
|
|
Officer |
|
|
|
|
|
|
|
|
|
|
|
|
|
|
|
|
|
|
|
|
|
|
|
|
|
|
|
|
|
|
|
|
|
|
|
|
|
|
|
|
|
|
|
|
|
49
|
|
|
|
|
|
|
|
|
|
ALL OTHER COMPENSATION TABLE | ||||||||||||||||||||||||||||||||
|
|
|
| Employer Contributions Under |
|
|
|
|
|
|
|
|
|
|
|
|
|
| ||||||||||||||
Name | Life |
|
| Employer | Employer | Employer | Executive | Financial |
|
| Charitable | Total | ||||||||||||||||||||
Carey A. |
| 1,520 |
|
|
| 51,754 |
|
|
| 26,400 |
|
|
| 6,600 |
|
|
| 3,767 |
|
|
| — |
|
|
| 5,000 |
|
|
| 95,041 |
|
|
Matthew |
| 1,120 |
|
|
| 16,448 |
|
|
| 26,400 |
|
|
| 6,600 |
|
|
| — |
|
|
| — |
|
|
| 2,500 |
|
|
| 53,068 |
|
|
Michael R. |
| 25,750 |
|
|
| 14,753 |
|
|
| 26,400 |
|
|
| 6,600 |
|
|
| — |
|
|
| — |
|
|
| 5,000 |
|
|
| 78,503 |
|
|
Susan M. |
| 2,010 |
|
|
| 8,787 |
|
|
| 26,400 |
|
|
| 6,600 |
|
|
| 3,750 |
|
|
| 5,000 |
|
|
| 5,000 |
|
|
| 57,547 |
|
|
ALL OTHER COMPENSATION TABLE | ||||||||||||||||||||||||||||||||||||||||||||||||||
|
|
|
|
|
|
|
|
|
|
| Employer Contributions Under Defined Contribution Plans |
|
|
|
|
|
|
|
|
|
|
|
|
|
|
|
|
|
|
|
|
|
|
|
|
| ||||||||||||||
Name | Life Insurance ($) | Excess Liability Coverage ($) | Employer 2020 ERP Contribution ($) | Employer 2020 ESOP Contribution ($) | Employer 401(k) Match ($) | Executive Physical ($) | Financial Planning ($) | Relocation ($) |
|
| Charitable Matching Contribution ($) | Total ($) | ||||||||||||||||||||||||||||||||||||||
Charles L. Harrington |
|
| 7,424 |
|
|
|
| 1,986 |
|
|
|
| 68,400 |
|
|
|
| 22,800 |
|
|
|
| 5,700 |
|
|
|
| 2,400 |
|
|
|
| — |
|
|
|
| 26,104 |
|
|
|
| 5,000 |
|
|
|
| 139,814 |
|
|
Carey A. Smith |
|
| 1,520 |
|
|
|
| 1,986 |
|
|
|
| 33,071 |
|
|
|
| 22,800 |
|
|
|
| 5,700 |
|
|
|
| — |
|
|
|
| — |
|
|
|
| — |
|
|
|
| 5,000 |
|
|
|
| 70,076 |
|
|
George L. Ball |
|
| 6,089 |
|
|
|
| 1,986 |
|
|
|
| 24,293 |
|
|
|
| 22,800 |
|
|
|
| 5,700 |
|
|
|
| 1,045 |
|
|
|
| 140 |
|
|
|
| — |
|
|
|
| 5,000 |
|
|
|
| 67,052 |
|
|
Michael R. Kolloway |
|
| 25,750 |
|
|
|
| 1,986 |
|
|
|
| 13,846 |
|
|
|
| 22,800 |
|
|
|
| 5,700 |
|
|
|
| — |
|
|
|
| — |
|
|
|
| 56,853 |
|
|
|
| 5,000 |
|
|
|
| 131,935 |
|
|
Debra A. Fiori |
|
| 4,900 |
|
|
|
| 1,986 |
|
|
|
| 10,176 |
|
|
|
| 22,800 |
|
|
|
| 5,700 |
|
|
|
| 1,250 |
|
|
|
| 650 |
|
|
|
| — |
|
|
|
| 5,000 |
|
|
|
| 52,461 |
|
|
Grants of Plan-Based Awards Table
The following table presents, for each of the NEOs, information concerning each award granted during fiscal 2020.2023. This information supplements the information about these awards set forth in “—Summary Compensation Table.”
GRANTS OF PLAN-BASED AWARDS TABLE | ||||||||||||||||||||||||||||||||||||
|
|
| Estimated Payouts Under Non- |
| Estimated Future Payouts Under |
|
|
|
|
|
|
|
| |||||||||||||||||||||||
Named |
| Grant | Threshold | Target | Maximum |
| Threshold | Target | Maximum | All Other | Grant | |||||||||||||||||||||||||
Carey A. | AIP | 1/16/2023 |
|
| 625,000 |
|
|
| 1,250,000 |
|
|
| 2,500,000 |
|
|
|
|
|
|
|
|
|
|
|
|
|
|
|
|
|
| |||||
Smith | PSU | 2/27/2023 |
|
|
|
|
|
|
|
|
|
|
|
| 35,580 |
|
|
| 71,159 |
|
|
| 177,898 |
|
|
|
|
|
| 3,369,379 |
|
| ||||
| RSU | 2/27/2023 |
|
|
|
|
|
|
|
|
|
|
|
|
|
|
|
|
|
|
|
|
| 47,439 |
|
|
| 2,156,577 |
|
| ||||||
| PSU(3) | 12/18/2023 |
|
|
|
|
|
|
|
|
|
|
|
| 50,159 |
|
|
| 100,317 |
|
|
| 150,476 |
|
|
|
|
|
| 5,533,486 |
|
| ||||
| RSU | 12/18/2023 |
|
|
|
|
|
|
|
|
|
|
|
|
|
|
|
|
|
|
|
|
| 66,878 |
|
|
| 4,156,468 |
|
| ||||||
Matthew | AIP | 1/16/2023 |
|
| 230,934 |
|
|
| 461,869 |
|
|
| 923,738 |
|
|
|
|
|
|
|
|
|
|
|
|
|
|
|
|
|
| |||||
Ofilos | PSU | 2/27/2023 |
|
|
|
|
|
|
|
|
|
|
|
| 7,415 |
|
|
| 14,830 |
|
|
| 37,075 |
|
|
|
|
|
| 702,201 |
|
| ||||
RSU | 2/27/2023 |
|
|
|
|
|
|
|
|
|
|
|
|
|
|
|
|
|
|
|
|
| 9,886 |
|
|
| 449,418 |
|
| |||||||
Michael R. | AIP | 1/16/2023 |
|
| 194,119 |
|
|
| 388,238 |
|
|
| 776,475 |
|
|
|
|
|
|
|
|
|
|
|
|
|
|
|
|
|
| |||||
Kolloway | PSU | 2/27/2023 |
|
|
|
|
|
|
|
|
|
|
|
| 6,451 |
|
|
| 12,901 |
|
|
| 32,253 |
|
|
|
|
|
| 610,862 |
|
| ||||
| RSU | 2/27/2023 |
|
|
|
|
|
|
|
|
|
|
|
|
|
|
|
|
|
|
|
|
| 8,601 |
|
|
| 391,001 |
|
| ||||||
Susan M. | AIP | 1/16/2023 |
|
| 168,328 |
|
|
| 336,656 |
|
|
| 673,313 |
|
|
|
|
|
|
|
|
|
|
|
|
|
|
|
|
|
| |||||
Balaguer | PSU | 2/27/2023 |
|
|
|
|
|
|
|
|
|
|
|
| 2,993 |
|
|
| 5,985 |
|
|
| 14,963 |
|
|
|
|
|
| 283,390 |
|
| ||||
RSU | 2/27/2023 |
|
|
|
|
|
|
|
|
|
|
|
|
|
|
|
|
|
|
|
|
| 3,990 |
|
|
| 181,385 |
|
| |||||||
GRANTS OF PLAN-BASED AWARDS TABLE | ||||||||||||||||||||||||||||||||||||||||||||||||
|
|
|
|
| Estimated Payouts Under Non- Equity Incentive Plan Awards (1) |
| Estimated Future Payouts Under Equity Incentive Plan Awards (2) |
|
|
|
|
|
|
|
|
|
|
|
|
| ||||||||||||||||||||||||||||
Named Executive Officer |
|
| Grant Date |
| Threshold ($) |
| Target ($) |
| Maximum ($) |
| Threshold (#) |
| Target (#) | Maximum (#) |
|
| All Other Stock Awards: Number of Shares of Stock or Units (3)(#) |
| Grant Date Fair Market Value of Stock Awards (4) ($) | |||||||||||||||||||||||||||||
Charles L. | AIP |
| 1/20/2020 |
|
|
| 712,500 |
|
|
|
|
| 1,425,000 |
|
|
|
|
| 2,850,000 |
|
|
|
|
|
|
|
|
|
|
|
|
|
|
|
|
|
|
|
|
|
|
|
|
|
|
|
|
|
Harrington | PSU |
| 3/5/2020 |
|
|
|
|
|
|
|
|
|
|
|
|
|
|
|
|
|
|
|
|
| 39,143 |
|
|
|
|
| 78,285 |
|
|
| 195,713 |
|
|
|
|
|
|
|
|
|
| 3,008,493 |
|
|
| RSU |
| 3/5/2020 |
|
|
|
|
|
|
|
|
|
|
|
|
|
|
|
|
|
|
|
|
|
|
|
|
|
|
|
|
|
|
|
|
|
|
|
| 52,190 |
|
|
|
|
| 1,965,997 |
|
|
Carey A. | AIP |
| 1/20/2020 |
|
|
| 385,000 |
|
|
|
|
| 770,000 |
|
|
|
|
| 1,540,000 |
|
|
|
|
|
|
|
|
|
|
|
|
|
|
|
|
|
|
|
|
|
|
|
|
|
|
|
|
|
Smith | PSU |
| 3/5/2020 |
|
|
|
|
|
|
|
|
|
|
|
|
|
|
|
|
|
|
|
|
| 10,989 |
|
|
|
|
| 21,977 |
|
|
| 54,943 |
|
|
|
|
|
|
|
|
|
| 844,576 |
|
|
| RSU |
| 3/5/2020 |
|
|
|
|
|
|
|
|
|
|
|
|
|
|
|
|
|
|
|
|
|
|
|
|
|
|
|
|
|
|
|
|
|
|
|
| 14,651 |
|
|
|
|
| 551,903 |
|
|
| RSU |
| 1/21/2020 |
|
|
|
|
|
|
|
|
|
|
|
|
|
|
|
|
|
|
|
|
|
|
|
|
|
|
|
|
|
|
|
|
|
|
|
| 35,000 |
|
|
|
|
| 1,508,850 |
|
|
George L. | AIP |
| 1/20/2020 |
|
|
| 297,500 |
|
|
|
|
| 595,000 |
|
|
|
|
| 1,190,000 |
|
|
|
|
|
|
|
|
|
|
|
|
|
|
|
|
|
|
|
|
|
|
|
|
|
|
|
|
|
Ball | PSU |
| 3/5/2020 |
|
|
|
|
|
|
|
|
|
|
|
|
|
|
|
|
|
|
|
|
| 7,053 |
|
|
|
|
| 14,105 |
|
|
| 35,263 |
|
|
|
|
|
|
|
|
|
| 542,055 |
|
|
| RSU |
| 3/5/2020 |
|
|
|
|
|
|
|
|
|
|
|
|
|
|
|
|
|
|
|
|
|
|
|
|
|
|
|
|
|
|
|
|
|
|
|
| 9,403 |
|
|
|
|
| 354,211 |
|
|
Michael R. | AIP |
| 1/20/2020 |
|
|
| 178,125 |
|
|
|
|
| 356,250 |
|
|
|
|
| 712,500 |
|
|
|
|
|
|
|
|
|
|
|
|
|
|
|
|
|
|
|
|
|
|
|
|
|
|
|
|
|
Kolloway | PSU |
| 3/5/2020 |
|
|
|
|
|
|
|
|
|
|
|
|
|
|
|
|
|
|
|
|
| 4,776 |
|
|
|
|
| 9,552 |
|
|
| 23,880 |
|
|
|
|
|
|
|
|
|
| 367,083 |
|
|
| RSU |
| 3/5/2020 |
|
|
|
|
|
|
|
|
|
|
|
|
|
|
|
|
|
|
|
|
|
|
|
|
|
|
|
|
|
|
|
|
|
|
|
| 6,368 |
|
|
|
|
| 239,883 |
|
|
Debra A. | AIP |
| 1/20/2020 |
|
|
| 157,500 |
|
|
|
|
| 315,000 |
|
|
|
|
| 630,000 |
|
|
|
|
|
|
|
|
|
|
|
|
|
|
|
|
|
|
|
|
|
|
|
|
|
|
|
|
|
Fiori | PSU |
| 3/5/2020 |
|
|
|
|
|
|
|
|
|
|
|
|
|
|
|
|
|
|
|
|
| 3,771 |
|
|
|
|
| 7,541 |
|
|
| 18,853 |
|
|
|
|
|
|
|
|
|
| 289,801 |
|
|
| RSU |
| 3/5/2020 |
|
|
|
|
|
|
|
|
|
|
|
|
|
|
|
|
|
|
|
|
|
|
|
|
|
|
|
|
|
|
|
|
|
|
|
| 5,027 |
|
|
|
|
| 189,367 |
|
|
50
|
|
|
|
|
|
|
|
|
Outstanding Long-Term Incentive Awards at Fiscal Year-End Table
The following table summarizes the number of shares of common stock underlying our cash settled LTGP awards granted in 2018, and our RSU and PSU awards granted in 20192023, 2022 and 2020,2021, for each NEO as of December 31, 2020.2023.
OUTSTANDING LONG-TERM INCENTIVE AWARDS AT FISCAL YEAR-END TABLE | |||||||||||||||||||||||
Named |
|
|
| Number of |
| Market Value |
| Number of | Market Value | ||||||||||||||
Carey A. |
| 2023 RSU(2) |
|
| 66,878 |
|
|
|
| 4,193,919 |
|
|
|
|
|
|
|
|
|
|
| ||
Smith |
| 2023 PSU(4) |
|
|
|
|
|
|
|
|
| 100,317 |
|
|
|
|
| 6,290,879 |
|
| |||
|
| 2023 RSU(2) |
|
| 47,439 |
|
|
|
| 2,974,900 |
|
|
|
|
|
|
|
|
|
| |||
|
| 2023 PSU(3) |
|
|
|
|
|
|
|
|
| 71,159 |
|
|
|
|
| 4,462,381 |
|
| |||
|
| 2022 RSU(5) |
|
| 34,654 |
|
|
|
| 2,173,152 |
|
|
|
|
|
|
|
|
|
| |||
|
| 2022 PSU(7) |
|
|
|
|
|
|
|
|
| 77,970 |
|
|
|
|
| 4,889,499 |
|
| |||
|
| 2021 RSU(8) |
|
| 7,825 |
|
|
|
| 490,706 |
|
|
|
|
|
|
|
|
|
| |||
|
| 2021 PSU(9) |
|
|
|
|
|
|
|
|
| 35,210 |
|
|
|
|
| 2,208,019 |
|
| |||
|
| 2021 RSU(8) |
|
| 5,724 |
|
|
|
| 358,952 |
|
|
|
|
|
|
|
|
|
| |||
|
| 2021 PSU(9) |
|
|
|
|
|
|
|
|
| 25,756 |
|
|
|
|
| 1,615,159 |
|
| |||
Matthew |
| 2023 RSU(2) |
|
| 9,886 |
|
|
|
| 619,951 |
|
|
|
|
|
|
|
|
|
| |||
Ofilos |
| 2023 PSU(3) |
|
|
|
|
|
|
|
|
| 14,830 |
|
|
|
|
| 929,989 |
|
| |||
|
| 2022 RSU(5) |
|
| 5,462 |
|
|
|
| 342,522 |
|
|
|
|
|
|
|
|
|
| |||
|
| 2022 RSU(6) |
|
| 12,800 |
|
|
|
| 802,688 |
|
|
|
|
|
|
|
|
|
| |||
| 2022 PSU(7) |
|
|
|
|
|
|
|
|
| 12,288 |
|
|
|
|
| 770,580 |
|
| ||||
| 2022 RSU(5) |
|
| 1,072 |
|
|
|
| 67,225 |
|
|
|
|
|
|
|
|
|
| ||||
| 2022 PSU(7) |
|
|
|
|
|
|
|
|
| 2,413 |
|
|
|
|
| 151,319 |
|
| ||||
Michael R. |
| 2023 RSU(2) |
|
| 8,601 |
|
|
|
| 539,369 |
|
|
|
|
|
|
|
|
|
| |||
Kolloway |
| 2023 PSU(3) |
|
|
|
|
|
|
|
|
| 12,901 |
|
|
|
|
| 809,022 |
|
| |||
|
| 2022 RSU(5) |
|
| 6,600 |
|
|
|
| 413,886 |
|
|
|
|
|
|
|
|
|
| |||
|
| 2022 PSU(7) |
|
|
|
|
|
|
|
|
| 14,851 |
|
|
|
|
| 931,306 |
|
| |||
|
| 2021 RSU(8) |
|
| 2,801 |
|
|
|
| 175,651 |
|
|
|
|
|
|
|
|
|
| |||
|
| 2021 PSU(9) |
|
|
|
|
|
|
|
|
| 12,601 |
|
|
|
|
| 790,209 |
|
| |||
Susan M. |
| 2023 RSU(2) |
|
| 3,990 |
|
|
|
| 250,213 |
|
|
|
|
|
|
|
|
|
| |||
Balaguer |
| 2023 PSU(3) |
|
|
|
|
|
|
|
|
| 5,985 |
|
|
|
|
| 375,319 |
|
| |||
|
| 2022 RSU(6) |
|
| 10,829 |
|
|
|
| 679,087 |
|
|
|
|
|
|
|
|
|
| |||
|
| 2022 RSU(5) |
|
| 3,523 |
|
|
|
| 220,927 |
|
|
|
|
|
|
|
|
|
| |||
| 2022 PSU(7) |
|
|
|
|
|
|
|
|
| 7,926 |
|
|
|
|
| 497,039 |
|
| ||||
| 2021 RSU(8) |
|
| 1,357 |
|
|
|
| 85,097 |
|
|
|
|
|
|
|
|
|
| ||||
| 2021 PSU(9) |
|
|
|
|
|
|
|
|
| 6,107 |
|
|
|
|
| 382,970 |
|
| ||||
OUTSTANDING LONG-TERM INCENTIVE AWARDS AT FISCAL YEAR-END TABLE | |||||||||||||||||||||||||||
Named Executive Officer |
|
|
|
| Number of LTGP Units and RSUs That Have Not Vested (#) |
| Market Value of LTGP Units and RSUs That Have Not Vested ($) (1) |
| Number of Unearned PSUs That Have Not Vested (#) |
| Market Value of Unearned PSUs That Have Not Vested ($) (1) | ||||||||||||||||
Charles L. |
| 2020 RSU(2) |
|
|
|
| 52,190 |
|
|
|
|
| 1,900,238 |
|
|
|
|
|
|
|
|
|
|
|
|
|
|
Harrington |
| 2020 PSU(3) |
|
|
|
|
|
|
|
|
|
|
|
|
|
|
|
| 78,285 |
|
|
|
|
| 2,850,357 |
|
|
|
| 2019 RSU(4) |
|
|
|
| 26,667 |
|
|
|
|
| 970,945 |
|
|
|
|
|
|
|
|
|
|
|
|
|
|
|
| 2019 PSU(5) |
|
|
|
|
|
|
|
|
|
|
|
|
|
|
|
| 120,000 |
|
|
|
|
| 4,369,200 |
|
|
|
| 2018 LTGP(6) |
|
|
|
| 58,941 |
|
|
|
|
| 2,146,042 |
|
|
|
|
|
|
|
|
|
|
|
|
|
|
Carey A. Smith |
| 2020 RSU(2) |
|
|
|
| 14,651 |
|
|
|
|
| 533,443 |
|
|
|
|
|
|
|
|
|
|
|
|
|
|
|
| 2020 RSU(2) |
|
|
|
| 35,000 |
|
|
|
|
| 1,274,350 |
|
|
|
|
|
|
|
|
|
|
|
|
|
|
|
| 2020 PSU(3) |
|
|
|
|
|
|
|
|
|
|
|
|
|
|
|
| 21,977 |
|
|
|
|
| 800,183 |
|
|
|
| 2019 RSU(4) |
|
|
|
| 5,556 |
|
|
|
|
| 202,294 |
|
|
|
|
|
|
|
|
|
|
|
|
|
|
|
| 2019 PSU(5) |
|
|
|
|
|
|
|
|
|
|
|
|
|
|
|
| 24,999 |
|
|
|
|
| 910,214 |
|
|
|
| 2018 LTGP(6) |
|
|
|
| 10,925 |
|
|
|
|
| 397,779 |
|
|
|
|
|
|
|
|
|
|
|
|
|
|
George L. Ball |
| 2020 RSU(2) |
|
|
|
| 9,403 |
|
|
|
|
| 342,363 |
|
|
|
|
|
|
|
|
|
|
|
|
|
|
|
| 2020 PSU(3) |
|
|
|
|
|
|
|
|
|
|
|
|
|
|
|
| 14,105 |
|
|
|
|
| 513,563 |
|
|
|
| 2019 RSU(4) |
|
|
|
| 5,000 |
|
|
|
|
| 182,050 |
|
|
|
|
|
|
|
|
|
|
|
|
|
|
|
| 2019 PSU(5) |
|
|
|
|
|
|
|
|
|
|
|
|
|
|
|
| 22,500 |
|
|
|
|
| 819,225 |
|
|
|
| 2018 LTGP(6) |
|
|
|
| 11,393 |
|
|
|
|
| 414,819 |
|
|
|
|
|
|
|
|
|
|
|
|
|
|
Michael R. |
| 2020 RSU(2) |
|
|
|
| 6,368 |
|
|
|
|
| 231,859 |
|
|
|
|
|
|
|
|
|
|
|
|
|
|
Kolloway |
| 2020 PSU(3) |
|
|
|
|
|
|
|
|
|
|
|
|
|
|
|
| 9,552 |
|
|
|
|
| 347,788 |
|
|
|
| 2019 RSU(4) |
|
|
|
| 2,417 |
|
|
|
|
| 88,003 |
|
|
|
|
|
|
|
|
|
|
|
|
|
|
|
| 2019 PSU(5) |
|
|
|
|
|
|
|
|
|
|
|
|
|
|
|
| 10,875 |
|
|
|
|
| 395,959 |
|
|
|
| 2018 LTGP(6) |
|
|
|
| 5,258 |
|
|
|
|
| 191,444 |
|
|
|
|
|
|
|
|
|
|
|
|
|
|
Debra A. |
| 2020 RSU(2) |
|
|
|
| 5,027 |
|
|
|
|
| 183,033 |
|
|
|
|
|
|
|
|
|
|
|
|
|
|
Fiori |
| 2020 PSU(3) |
|
|
|
|
|
|
|
|
|
|
|
|
|
|
|
| 7,541 |
|
|
|
|
| 274,568 |
|
|
|
| 2019 RSU(4) |
|
|
|
| 2,233 |
|
|
|
|
| 81,304 |
|
|
|
|
|
|
|
|
|
|
|
|
|
|
|
| 2019 PSU(5) |
|
|
|
|
|
|
|
|
|
|
|
|
|
|
|
| 10,050 |
|
|
|
|
| 365,921 |
|
|
|
| 2018 LTGP(6) |
|
|
|
| 5,258 |
|
|
|
|
| 191,444 |
|
|
|
|
|
|
|
|
|
|
|
|
|
|
51
52
|
|
|
|
|
|
|
|
|
|
|
|
Long-Term Incentive Awards that Vested in 20202023
The following sets forth the number of SVP, LTGPRSUs and RAU units and RSUsPSUs that vested in 2020. SVP, LTGP and RAU units2023.
LONG-TERM INCENTIVE AWARDS VESTED TABLE | |||||||||||||||||||||
PSU Awards |
| RSU Awards |
| ||||||||||||||||||
Named Executive | Number of PSUs | Value Realized |
| Number of RSU | Value Realized |
| |||||||||||||||
Carey A. Smith |
|
| 20,602 |
|
|
|
| 936,567 |
|
|
|
|
| 35,758 |
|
|
| 1,633,773 |
|
|
|
Matthew Ofilos |
|
| — |
|
|
|
| — |
|
|
|
|
| 9,685 |
|
|
| 521,967 |
|
|
|
Michael R. Kolloway |
|
| 8,955 |
|
|
|
| 407,094 |
|
|
|
|
| 8,224 |
|
|
| 370,639 |
|
|
|
Susan M. Balaguer |
|
| — |
|
|
|
| — |
|
|
|
|
| 3,118 |
|
|
| 143,450 |
|
|
|
LONG-TERM INCENTIVE AWARDS VESTED TABLE |
| |||||||||||||||||||||||||||||||||
|
|
| SVP Awards |
|
|
|
| LTGP and RAU Awards |
|
|
|
| RSU Awards |
| ||||||||||||||||||||
Named Executive Officer |
| Number of Shares Subject to SVP (#) (1) |
| Value Realized ($) |
| Number of LTGP and RAU Units Acquired on Vesting (#) (2) |
| Value Realized on Vesting ($) |
| Number of RSU Awards Vested (#) (3) |
| Value Realized on Vesting ($) (4) |
| |||||||||||||||||||||
Charles L. Harrington |
|
|
| 529,983 |
|
|
|
|
| 5,835,113 |
|
|
|
|
| 116,371 |
|
|
|
|
| 4,122,685 |
|
|
|
|
| 26,667 |
|
|
|
| 970,945 |
|
Carey A. Smith |
|
|
| 98,259 |
|
|
|
|
| 1,081,832 |
|
|
|
|
| 46,495 |
|
|
|
|
| 1,594,579 |
|
|
|
|
| 5,556 |
|
|
|
| 202,294 |
|
George L. Ball |
|
|
| 102,462 |
|
|
|
|
| 1,128,107 |
|
|
|
|
| 22,429 |
|
|
|
|
| 794,439 |
|
|
|
|
| 5,000 |
|
|
|
| 182,050 |
|
Michael R. Kolloway |
|
|
| 47,298 |
|
|
|
|
| 520,751 |
|
|
|
|
| 5,904 |
|
|
|
|
| 198,847 |
|
|
|
|
| 2,417 |
|
|
|
| 88,003 |
|
Debra A. Fiori |
|
|
| 47,298 |
|
|
|
|
| 520,751 |
|
|
|
|
| 10,352 |
|
|
|
|
| 366,670 |
|
|
|
|
| 2,233 |
|
|
|
| 81,304 |
|
|
|
|
|
|
|
|
|
Nonqualified Defined Contribution and Other Nonqualified Deferred Compensation
Parsons Executive Restoration Plan (“ERP”): The ERP provides a vehicle to restore qualified plan benefits that are reduced because of limitations on compensation imposed under the Code under the ESOP and the 401(k) plan. The amount credited to a NEO under the ERP is equal to a percentage of the NEO’s eligible compensation under the ESOP based on the total percentage of compensation that we contribute to the ESOP. NEOs vest in their ERP accounts in accordance with the same vesting schedule as the ESOP. Vested ERP account balances are paid in cash in a lump sum upon a NEO’s termination of employment, or, if so elected by the NEO, upon a change in control or substantial financial hardship.
The amount credited to a NEO under the ERP will be equal to a percentage of the NEO’s eligible compensation under the ESOP based on the total percentage of compensation that we contribute to the ESOP. The ERP will earn an annual rate of interest on the ERP funds equal to the average of prime rates made available to preferred borrowers by Bank of America, N.T. & S.A., Los Angeles Branch (or any successor thereto) determined as of the first working day of each calendar month prior to the complete distribution of an ERP account.
NONQUALIFIED DEFERRED COMPENSATION TABLE | ||||||||||||||||||||
Named Executive Officer | Registrant | Aggregate | Aggregate | Aggregate | ||||||||||||||||
Carey A. Smith |
|
|
|
|
|
|
|
|
|
|
|
|
|
|
|
| ||||
Executive Restoration Plan |
|
| 51,754 |
|
|
|
| 18,822 |
|
|
|
| — |
|
|
|
| 301,544 |
|
|
Matthew Ofilos |
|
|
|
|
|
|
|
|
|
|
|
|
|
|
|
| ||||
Executive Restoration Plan |
|
| 16,448 |
|
|
|
| 832 |
|
|
|
| — |
|
|
|
| 27,496 |
|
|
Michael R. Kolloway |
|
|
|
|
|
|
|
|
|
|
|
|
|
|
|
| ||||
Executive Restoration Plan |
|
| 14,753 |
|
|
|
| 8,330 |
|
|
|
| — |
|
|
|
| 125,294 |
|
|
Susan M. Balaguer |
|
|
|
|
|
|
|
|
|
|
|
|
|
|
|
| ||||
Executive Restoration Plan |
|
| 8,787 |
|
|
|
| 764 |
|
|
|
| — |
|
|
|
| 18,928 |
|
|
Bonus and Equity Deferrals Prior to 2019: Prior to 2019, our NEOs were eligible defer their annual cash incentive bonus under our Bonus Deferral Plan, and the value of their LTGP, SVP and RAU awards. We discontinued offering these deferral alternatives to our NEOs in 2019.
The Bonus Deferral Plan: Our NEOs were eligible to participateEmployer contributions are reported as “All Other Compensation” for 2023 in the Bonus Deferral Plan, which is a non-qualified deferred compensation plan that allowed them to meet their retirement and other future income needs by deferring all or a portion of their annual cash incentive bonus. The amount deferred earns interest each year at a rate equal to the average of the annual prime rates made available to preferred borrowers by the Los Angeles branch of Bank of America. Benefits under this plan are payable upon termination of employment, a specified future date, or upon a change in control if so elected by the executive. Only Mr. Harrington and Mr. Ball have participated in this plan.
53
SVP Deferrals: Prior to 2019, participants in the SVP were eligible to elect to defer 0% or 25% to 100% of the SVP awards that may become payable under such plan until the later of the participant’s termination of employment or at the date elected. Participants could then elect that amounts that are to become payable upon such participant’s termination due to retirement or disability be paid in a lump sum payment, five substantially equal annual installments or ten substantially equal annual installments. SVP deferrals will also be paid within 30 days following a change in control. Only Mr. Ball has elected to defer a portion of his SVP awards granted to him prior to 2019.
Legacy Plans: We also have three other historical deferred compensation plans pursuant to which executives were allowed to defer their long-term incentives, which we refer to as the “Legacy Plans” below. Deferrals under those plans also earn interest at the average of the annual prime rates made available to preferred borrowers by the Los Angeles branch of Bank of America.
NONQUALIFIED DEFERRED COMPENSATION TABLE | ||||||||||||||||||||||||||||||
Named Executive Officer |
| Executive Contributions in Last FY ($) |
| Registrant Contributions in Last FY ($) |
| Aggregate Earnings in Last FY ($) |
| Aggregate Withdrawals/ Distributions ($) |
| Aggregate Balance at Last FYE ($) | ||||||||||||||||||||
Charles L. Harrington |
|
|
|
|
|
|
|
|
|
|
|
|
|
|
|
|
|
|
|
|
|
|
|
|
|
|
|
|
|
|
Executive Restoration Plan |
|
|
| — |
|
|
|
|
| 68,400 |
|
|
|
|
| 78,278 |
|
|
|
|
| — |
|
|
|
|
| 2,307,294 |
|
|
Bonus Plan |
|
|
| — |
|
|
|
|
| — |
|
|
|
|
| 4,999 |
|
|
|
|
| — |
|
|
|
|
| 142,984 |
|
|
Legacy Plan |
|
|
| — |
|
|
|
|
| — |
|
|
|
|
| 19,376 |
|
|
|
|
| — |
|
|
|
|
| 554,199 |
|
|
Carey A. Smith |
|
|
|
|
|
|
|
|
|
|
|
|
|
|
|
|
|
|
|
|
|
|
|
|
|
|
|
|
|
|
Executive Restoration Plan |
|
|
| — |
|
|
|
|
| 33,071 |
|
|
|
|
| 3,403 |
|
|
|
|
| — |
|
|
|
|
| 130,414 |
|
|
George L. Ball |
|
|
|
|
|
|
|
|
|
|
|
|
|
|
|
|
|
|
|
|
|
|
|
|
|
|
|
|
|
|
Executive Restoration Plan |
|
|
| — |
|
|
|
|
| 24,293 |
|
|
|
|
| 25,511 |
|
|
|
|
| — |
|
|
|
|
| 753,941 |
|
|
Bonus Plan |
|
|
| — |
|
|
|
|
| — |
|
|
|
|
| 23,644 |
|
|
|
|
| — |
|
|
|
|
| 676,251 |
|
|
Shareholder Value Plan |
|
|
| — |
|
|
|
|
| — |
|
|
|
|
| 551 |
|
|
|
|
| — |
|
|
|
|
| 15,772 |
|
|
Legacy Plan |
|
|
| — |
|
|
|
|
| — |
|
|
|
|
| 26,514 |
|
|
|
|
| — |
|
|
|
|
| 758,344 |
|
|
Michael R. Kolloway |
|
|
|
|
|
|
|
|
|
|
|
|
|
|
|
|
|
|
|
|
|
|
|
|
|
|
|
|
|
|
Executive Restoration Plan |
|
|
| — |
|
|
|
|
| 13,846 |
|
|
|
|
| 1,764 |
|
|
|
|
| — |
|
|
|
|
| 64,307 |
|
|
Debra A. Fiori |
|
|
|
|
|
|
|
|
|
|
|
|
|
|
|
|
|
|
|
|
|
|
|
|
|
|
|
|
|
|
Executive Restoration Plan |
|
|
| — |
|
|
|
|
| 10,176 |
|
|
|
|
| 2,331 |
|
|
|
|
| — |
|
|
|
|
| 76,844 |
|
|
|
|
20202023 CEO Pay Ratio
We are providing the following information regarding the relationship of the annual total compensation of our median employee to the annual total compensation of our CEO (in each case, the annual total compensation was calculated in accordance with SEC rules applicable to the Summary Compensation Table above). The pay ratio included in this information is a reasonable estimate calculated in a manner consistent with Item 402(u) of Regulation S-K.
For 2020:2023:
Our median employee’s annual total compensation was $96,020.
Our CEO’s annual total compensation, as reported in the Summary Compensation Table, was $8,231,959.
Based on this information, the ratio of the annual total compensation of our CEO to the annual total compensation of our median employee is 86177 to 1.
Pay Ratio Methodology
SEC rules allow us to select a methodology for identifying our median employee in a manner that is most appropriate based on our size, organizational structure and compensation plans, policies and procedures.procedures, and allow us to identify our median employee once every three years unless there has been a change in our employee population or employee compensation arrangements that we reasonably believe would result in significant change in our pay ratio disclosure.
We selected December 31, 20202023 as the date on which to determine our median employee, which is the last date of our last completed fiscal year.employee. As of that date, we had 15,12718,313 employees, with 9,65610,636 employees based in the United States and 5,4717,677 employees located outside of the United States. The pay ratio disclosure rules provide an exemption for companies to exclude non-U.S. employees from the median employee calculation if non-U.S. employees in a particular jurisdiction account for five percent (5%) or less of the company’sCompany’s total number of employees. We applied this de minimis exemption when identifying the median employee by excluding employees in 5 countries: 54 employees in Denmark, 1920 employees in France, 119 employees in in Germany, 2 in Hong Kong, and 1315 employees in the United Kingdom.
After taking into account the de minimis exemption, 9,65610,636 employees based in the United States and 5,4217,627 employees located outside of the United States were considered for purposes of identifying the median employee.
For purposes of identifying the median employee from our employee population base, we considered base salary for 2020,2023, including overtime, as compiled from our payroll records. We selected base salary as this information is readily available in each country. In addition, we measured compensation for purposes of determining the median employee using the year-to-date period ended December 31, 20202023 and annualized for all regular employees who were employed on December 31, 20202023 but did not work for us for all of 2020.2023. Compensation paid in foreign currencies was converted to U.S. dollars based on exchange rates in effect on December 24, 2020.30, 2023.
Ms. Smith’s 2023 annual total compensation calculated herein of $18,596,895 includes her annual base salary, annual incentive plan payout, long term incentive awards, one-time equity award package, and all other compensation as reported in the ‘All Other Compensation’ table in this proxy statement.
54
Potential Payments upon Termination or Change in Control
Payments and benefits that would be provided to each NEO in addition to those received by all employees (such as payout of 401(k) balances and paid time off) as a result of certain termination events are set forth in the table below. The amounts shown assume a qualifying termination of employment effective as of the last day of our fiscal year ended December 31, 2023.
Corporate Vice President Severance Plan
Each NEO currently employed by the Company is an eligible employee under Parsons Corporate Vice President Severance Plan (the "Severance Plan"). The Severance Plan provides that, upon the termination of employment of an eligible employee by the Company other than for Performance (as defined in the Severance Plan) or due to death or disability (other than a termination in connection with a change in control of the Company), in addition to the payment of accrued obligations, the eligible employee will receive the following compensation and benefits: (i) a lump sum payment equal to four and a half (4.5) times the eligible employee's base monthly salary (for a regular full-time eligible employee, shall be determined by using the employee’s full, regular base salary rate on his or her termination date, and for a regular part-time eligible employee, shall be determined by using the employee’s average monthly regular base salary rate over the 12-month period immediately preceding his or her termination date); and (ii) the Company shall pay , on behalf of the eligible employee, four (4) months of COBRA premiums for medical, dental and vision care coverage. The receipt of the foregoing severance payments and benefits will be subject to the eligible employee's execution of a separation and release agreement that contains customary restrictive covenants, including obligations with respect to non-compete, non-solicitation and confidentiality.
Change in Control Agreements
The NEOs are eligible to receive certain severance payments and benefits in connection with various circumstances in connection with a change in control of the Company. The potential severance
payments and benefits payable to thesethe NEOs in the event of termination of employment in place as of December 31, 2020fiscal year end are described below and were determined pursuant to the terms of their individual change in control and severance agreements, or the CIC Agreements, as applicable, are described below.applicable.
The CIC Agreements provide severance protections to the NEOs in the event of a resignation by the executive for “Good Reason” or a termination by Parsons without “Cause” (as each such term is defined below) within eighteen months following a change in control or if any successor company fails to assume the CIC Agreement or repudiates or breaches any provision of the CIC Agreement within such eighteen month period (any such event, a “Qualifying Event”).
Under the CIC Agreements, if a Qualifying Event occurs, the executive is eligible to receive the following severance payments and benefits, subject to his or her written notice to the Company of such Qualifying Event, his or her execution of an effective release of claims in favor of the Company and continued compliance with his or her restrictive covenants,covenants. Such payments are payable in a lump sum no later than two and a half months following the Qualifying Event, subject to any delays imposed by Section 409A of the Code:
a pro rata portion (based on number of days that elapsed in the calendar year before the Qualifying Event occurred) of the greater of (1) the executive’s target annual bonus for the year of the Qualifying Event or (2) the executive’s annual bonus that would have been paid (as
55
an amount equal to the highest rate of the executive’s annualized base salary in effect at any time up to and including the Qualifying Event multiplied by two, or for the CEO multipliedExecutive Chairman by three;
an amount equal to the greater of (1) the executive’s target annual bonus for the year of the Qualifying Event or (2) the average of the annual bonuses actually paid to the executive for the two years preceding the year of the Qualifying Event, multiplied by two, or for the CEOExecutive Chairman multiplied by three; and
a non-discounted cash lump sum amount equal to the sum of the following: (1) the Company’s estimate of the costs for the executive’s medical insurance coverage at the level and a cost to the executive comparable to that provided to the executive immediately prior to the Qualifying Event for a period of two years, or three years for the CEO,Executive Chairman, following such Qualifying Event (which, in the Company’s discretion, may be based on the applicable COBRA rates); (2) the Company’s estimate of the costs for the continuation of that level of the executive’s life insurance coverage that is in effect immediately prior to the Qualifying Event, for a period of two years, or three years for the CEO,Executive Chairman, following such Qualifying Event, or, if shorter, the period ending on the last day of the level premium rate guarantee period established by the applicable insurer for such coverage; and (3) the Company’s estimate of the cost for the continuation of the executive’s executive supplemental disability coverage under the Company’s supplemental disability insurance plan in effect immediately prior to the Qualifying Event for a period of two years, or three years for the CEO,Executive Chairman, following such Qualifying Event (or the date the executive attains age 65, if earlier), but the cash payment in this clause (3) will only be paid if the terms of the applicable insurance policy under such disability insurance plan provide that the coverage may be continued following the Qualifying Event and such costs to be estimated using the extent of the coverage allowed under the terms such policy at a cost to the Company that is no greater than the cost borne by the Company immediately prior to the Qualifying Event.
For purposes of the CIC Agreements, a “change in control” has the same definition as is given to such term in our 2019 Incentive Award Plan.
For purposes of the CIC Agreements, (1) “Cause” means the executive’s (a) commission of fraud or embezzlement in connection with Parsons; (b) conviction of, or pleading guilty or nolo contendere to, a felony involving fraud, dishonesty or moral turpitude; or (c) willful and continued failure to substantially perform material duties which is not remedied in a reasonable period of time after written noticedemand for substantial performances is delivered by the Board; or d) material violation of the Company’s Code of Conduct and (2) “Good Reason” means, without the Executive’s express written consent, the occurrence of any one or more of the following, events withoutunless the executive’s consent and whichaction or failure giving rise to such occurrence is notwithdrawn, reversed or cured by Parsonsthe Company within thirty (30) days of the date of such event’s occurrence: (a) a material reduction in the nature or status of the executive’sExecutive’s authorities, duties, and/or responsibilities (viewed(when such authorities, duties, and/or responsibilities are viewed in the aggregate) from thetheir level in effect on the day immediately prior to a change in control;the start of the Protected Period; (b) a reduction inby the executive’s base salaryCompany of the Executive’s Base Salary as in effect on the day immediately prior to a change in control;the start of the Protected Period; (c) a material reduction by the Company of the executive’sExecutive’s aggregate welfare benefits and/or the value of the incentive programs provided under Parsons’the Company’s management incentive and/or
56
other short and/or long-term incentive programs, as such benefits and opportunities existedexist on the day immediately prior to a change in control;the start of the Protected Period.; (d) relocation of the executive’sExecutive’s principal office by the Company more than fifty (50) miles from the location of the executive’sExecutive’s principal office as of the day immediately prior to a change in control;the start of the Protected Period; (e) any purported termination of the executive without satisfying the notice requirements in the CIC Agreement; and (f) Parsons’ failure to obtain agreement from any successor entity to assume and perform its obligations under the CIC Agreement.
The CIC Agreements provide that in the event that any payments would subject the NEO to the excise taxes applicable under Section 4999 of the Code by reason of being a parachute payment under Section 280G of the Code, then if it would cause a better net-after tax result, the amount of such payments will be reduced so that no excise tax would apply.
Additionally, our long-term incentive awards are eligible for accelerated vesting under certain circumstances. For a discussion of the accelerated vested terms of these awards, please see “Compensation Discussion and Analysis – Long-Term Incentive Awards” above.
Potential Payments upon Termination or Change in Control Table
The following table sets forth the estimated payments that would be received by the NEOs in four different scenarios – (1) a termination of employment without cause or following a resignation for good reason (involuntary termination) apart from a change in control, (2) a NEO’s retirement, (3) a NEO’s death or disability, and (4) an involuntary termination in connection with a change in control in the circumstances contemplated by the CIC Agreements described above, and (5) a change in control without a corresponding termination of employment.above. The table below reflects amounts payable to the NEOs assuming their employment was terminated on December 31, 20202023 and, if applicable, a change in control of our Company also occurred on that date, and therefore includes only long-term incentive awards outstanding on that date. For purposes of estimating the value of accelerated long-term incentive awards to be received in the event of a termination of employment or change in control, we have assumed a price per share of our common stock of $36.41,$62.71, which represents the closing market price of our common stock as reported on the NYSE on December 31, 2020.29, 2023. Each of the NEOs are participants in the deferred compensation plans described above under “—Nonqualified Defined Contribution and Other Nonqualified Deferred Compensation” and the ESOP. For more information about payments payable to the NEOs under these deferred compensation plans or the ESOP upon a termination of employment or a change in control, please see “—Nonqualified Defined
57
Contribution and Other Nonqualified Deferred Compensation” above and “—Employee Stock Ownership Plan” below.
Name | Involuntary | Retirement | Death or | Involuntary | ||||||||||||||||
Carey A. Smith |
|
|
|
|
|
|
|
|
|
|
|
|
|
|
|
| ||||
AIP Payout (3) |
|
| 2,290,200 |
|
|
|
| 2,290,200 |
|
|
|
| 2,290,200 |
|
|
|
| 2,290,200 |
|
|
Cash Severance (4) |
|
| 375,000 |
|
|
|
| — |
|
|
|
| — |
|
|
|
| 4,500,000 |
|
|
Benefits (5) |
|
| 9,954 |
|
|
|
| — |
|
|
|
| — |
|
|
|
| 59,723 |
|
|
Long-Term Incentive Award Acceleration |
|
| — |
|
|
|
| 14,568,014 |
|
|
|
| 11,065,003 |
|
|
|
| 29,657,566 |
|
|
Matthew Ofilos |
|
|
|
|
|
|
|
|
|
|
|
|
|
|
|
| ||||
AIP Payout (3) |
|
| 846,300 |
|
|
|
| 846,300 |
|
|
|
| 846,300 |
|
|
|
| 846,300 |
|
|
Cash Severance (4) |
|
| 203,766 |
|
|
|
| — |
|
|
|
| — |
|
|
|
| 2,010,488 |
|
|
Benefits (5) |
|
| 3,122 |
|
|
|
| — |
|
|
|
| — |
|
|
|
| 18,732 |
|
|
Long-Term Incentive Award Acceleration |
|
| 802,688 |
|
|
|
| 1,954,294 |
|
|
|
| 1,575,178 |
|
|
|
| 3,684,275 |
|
|
Michael R. Kolloway |
|
|
|
|
|
|
|
|
|
|
|
|
|
|
|
| ||||
AIP Payout (3) |
|
| 711,400 |
|
|
|
| 711,400 |
|
|
|
| 711,400 |
|
|
|
| 711,400 |
|
|
Cash Severance (4) |
|
| 194,119 |
|
|
|
| — |
|
|
|
| — |
|
|
|
| 1,811,775 |
|
|
Benefits (5) |
|
| 15,495 |
|
|
|
| — |
|
|
|
| — |
|
|
|
| 92,967 |
|
|
Long-Term Incentive Award Acceleration |
|
| — |
|
|
|
| 2,809,659 |
|
|
|
| 2,149,406 |
|
|
|
| 3,659,442 |
|
|
Susan M. Balaguer |
|
|
|
|
|
|
|
|
|
|
|
|
|
|
|
| ||||
AIP Payout (3) |
|
| 616,900 |
|
|
|
| 616,900 |
|
|
|
| 616,900 |
|
|
|
| 616,900 |
|
|
Cash Severance (4) |
|
| 168,328 |
|
|
|
| — |
|
|
|
| — |
|
|
|
| 1,571,063 |
|
|
Benefits (5) |
|
| 670 |
|
|
|
| — |
|
|
|
| — |
|
|
|
| 4,020 |
|
|
Long-Term Incentive Award Acceleration |
|
| — |
|
|
|
| 2,074,760 |
|
|
|
| 1,288,741 |
|
|
|
| 2,490,653 |
|
|
(1)
58
Name |
| Involuntary Termination without a Change in Control ($) |
| Retirement ($)(1) |
| Death or Disability($)(2) |
| Involuntary Termination in Connection with Change in Control ($) |
| Change in Control ($)(3) | ||||||||||||||||||||
Charles L. Harrington |
|
|
|
|
|
|
|
|
|
|
|
|
|
|
|
|
|
|
|
|
|
|
|
|
|
|
|
|
|
|
AIP Payout (4) |
|
|
| 1,875,000 |
|
|
|
|
| 1,875,000 |
|
|
|
|
| 1,875,000 |
|
|
|
|
| — |
|
|
|
|
| — |
|
|
Cash Severance (5) |
|
|
| — |
|
|
|
|
| — |
|
|
|
|
| — |
|
|
|
|
| 7,695,000 |
|
|
|
|
| — |
|
|
Benefits (6) |
|
|
| — |
|
|
|
|
| — |
|
|
|
|
| — |
|
|
|
|
| 82,790 |
|
|
|
|
| — |
|
|
Long-Term Incentive Award Acceleration |
|
|
| — |
|
|
|
|
| 5,848,052 |
|
|
|
|
| 6,375,875 |
|
|
|
|
| 12,075,873 |
|
|
|
|
| 12,075,873 |
|
|
Carey A. Smith |
|
|
|
|
|
|
|
|
|
|
|
|
|
|
|
|
|
|
|
|
|
|
|
|
|
|
|
|
|
|
AIP Payout (4) |
|
|
| 977,700 |
|
|
|
|
| 977,700 |
|
|
|
|
| 977,700 |
|
|
|
|
| — |
|
|
|
|
| — |
|
|
Cash Severance (5) |
|
|
| — |
|
|
|
|
| — |
|
|
|
|
| — |
|
|
|
|
| 4,410,000 |
|
|
|
|
| — |
|
|
Benefits (6) |
|
|
| — |
|
|
|
|
| — |
|
|
|
|
| — |
|
|
|
| 43,802 |
|
|
|
|
| — |
|
| |
Long-Term Incentive Award Acceleration |
|
|
| — |
|
|
|
|
| 1,241,491 |
|
|
|
|
| 2,026,824 |
|
|
|
|
| 3,554,982 |
|
|
|
|
| 3,554,982 |
|
|
George L. Ball |
|
|
|
|
|
|
|
|
|
|
|
|
|
|
|
|
|
|
|
|
|
|
|
|
|
|
|
|
|
|
AIP Payout (4) |
|
|
| 755,500 |
|
|
|
|
| 755,500 |
|
|
|
|
| 755,500 |
|
|
|
|
| — |
|
|
|
|
| — |
|
|
Cash Severance (5) |
|
|
| — |
|
|
|
|
| — |
|
|
|
|
| — |
|
|
|
| 3,570,000 |
|
|
|
|
| — |
|
| |
Benefits (6) |
|
|
| — |
|
|
|
|
| — |
|
|
|
|
| — |
|
|
|
| 34,338 |
|
|
|
|
| — |
|
| |
Long-Term Incentive Award Acceleration |
|
|
| — |
|
|
|
|
| 1,101,054 |
|
|
|
|
| 1,196,145 |
|
|
|
|
| 2,240,918 |
|
|
|
|
| 2,240,918 |
|
|
Michael R. Kolloway |
|
|
|
|
|
|
|
|
|
|
|
|
|
|
|
|
|
|
|
|
|
|
|
|
|
|
|
|
|
|
AIP Payout (4) |
|
|
| 452,400 |
|
|
|
|
| 452,400 |
|
|
|
|
| 452,400 |
|
|
|
|
| — |
|
|
|
|
| — |
|
|
Cash Severance (5) |
|
|
| — |
|
|
|
|
| — |
|
|
|
|
| — |
|
|
|
| 2,493,750 |
|
|
|
|
| — |
|
| |
Benefits (6) |
|
|
| — |
|
|
|
|
| — |
|
|
|
|
| — |
|
|
|
| 81,412 |
|
|
|
|
| — |
|
| |
Long-Term Incentive Award Acceleration |
|
|
| — |
|
|
|
|
| 556,911 |
|
|
|
|
| 621,376 |
|
|
|
|
| 1,240,698 |
|
|
|
|
| 1,240,698 |
|
|
Debra A. Fiori |
|
|
|
|
|
|
|
|
|
|
|
|
|
|
|
|
|
|
|
|
|
|
|
|
|
|
|
|
|
|
AIP Payout (4) |
|
|
| 400,000 |
|
|
|
|
| 400,000 |
|
|
|
|
| 400,000 |
|
|
|
|
| — |
|
|
|
|
| — |
|
|
Cash Severance (5) |
|
|
| — |
|
|
|
|
| — |
|
|
|
|
| — |
|
|
|
|
| 2,205,000 |
|
|
|
|
| — |
|
|
Benefits (6) |
|
|
| — |
|
|
|
|
| — |
|
|
|
|
| — |
|
|
|
|
| 50,008 |
|
|
|
|
| — |
|
|
Long-Term Incentive Award Acceleration |
|
|
| — |
|
|
|
|
| 512,559 |
|
|
|
|
| 563,381 |
|
|
|
|
| 1,081,914 |
|
|
|
|
| 1,081,914 |
|
|
|
|
|
|
|
|
|
|
|
|
|
|
Our employees participate in the ESOP, which is a defined contribution stock bonus retirement plan designed to enable eligible employees to obtain an ownership interest in Parsons. The ESOP is funded by contributions made by us which are held in a trust established as part of the ESOP. The contributions are invested in our common stock. Contributions and any earnings or dividends thereon, to the extent such amounts remain in the ESOP, accumulate on a tax deferred basis.
We may make discretionary contributions to the ESOP each year in an amount to be determined by our Board and may be made in cash or in shares of our common stock. We made contributions of 1,874,988915,113 shares in fiscal 2018, 1,345,1982023, 1,188,129 shares in fiscal 20192022, and 1,522,3811,631,477 shares in fiscal 20202021 of our common stock, net of forfeitures. In fiscal 2018, 20192023, 2022, and 2020,2021, we made annual contributions to the ESOP in shares of our common stock in the amount of 8% of the participants’ covered cash compensation for the applicable year (net of shares forfeited by participants in the applicable year). The annual contributions to the ESOP are allocated to participants’ accounts each year to participants who were eligible employees during the year, and the allocations are made on a basis proportional to compensation. Covered compensation for an eligible employee under the ESOP generally includes base pay, overtime pay, assignment premiums included in base pay and most pre-tax deductions. Bonuses, relocation expenses and most other reimbursements are generally excluded from covered compensation. Prior to 2020, participants vested in their ESOP accounts over a period of six years. Effective January 1, 2020, the vesting schedule was amended to provide for three-year ratable vesting of ESOP accounts for actively employed participants.
The value of vested account balances, subject to eligibility, vesting and distribution rules, are distributed to participants, generally only after their retirement from Parsons after attaining age 65 (or 62 if fully vested). Distributions will generally be in a series of installment payments over a number of years. Based on ESOP participants’ account balances and installment options, we expect distributions in the aggregate will generally be made ratably over three years. The number of installments is based on participant account balances at the time of distribution. In December 2020, the Board of Directors approved an amendment to the Employee Stock Ownership Plan to provide greater diversification rights to participants. The amendment provides that, with respect to all diversifications elected or processed after January 1, 2021, the definition of a qualified participant shall mean a participant who has attained the age of 50 and who has completed at least 3 years of participation in the Plan and other criteria. Each qualified participant shall generally be permitted to direct the Plan as to the diversification of 50% of the value of the eligible portion of the participant’s ESOP account. In January 2021, the Board of Directors approved an amendment to the ESOP effective March 1, 2021 whereby distributions to participants in the ESOP were modified as follows: (1) the threshold amount of an ESOP participant’s balance to be eligible for a single lump sum distribution was increased from less than $20,000 to less than $500,000; (2) the threshold balance for a participant to be eligible to receive payment in two installments was increased from less than $40,000 to less than $750,000; and (3) the threshold balance for participants to receive payment in three or five annual installments was increased to $750,000 or more. In April 2022, the board of directors approved an amendment providing for lump sum distributions to participants and removing the annual installments. Annual diversification elections and five-year vest termination distributions are not impacted by this amendment and will still occur annually over installments as outlined in the Plan.
59
The changes were made to facilitate greater flexibility for eligible participants to receive their balances in fewer installmentsexpeditiously and to accelerate the increase in publicly traded float for our common stock. Participants who have already commenced receiving distributions from the ESOP will have the option of opting out of the new thresholds and maintaining their previously elected distributions. Participants Distributionsdistributions prior to termination of employment or reaching retirement age (65 or 62 if fully vested) are generally not permitted, unless the participant dies. Participants who die priorDistributions to beginning their installments,beneficiaries of deceased participants, and participants who
receive conflict of interest distributions following termination of employment, are also paid in a lump sum.
With respect to cash dividends, if the Board declares and pays a cash dividend on shares of our common stock held in the ESOP and allocated to participant accounts, then, at the election of each participant, this dividend may either be paid currently to the participant either directly by us or through the ESOP or reinvested in our common stock and held in such participant’s account in the ESOP. Any such cash dividends to be paid currently to participants will be paid in cash. Dividends on shares of unallocated stock will not be distributed to the participant currently but will either be applied to pay off any ESOP loans or held in the ESOP. The ESOP currently does not have any ESOP loans.
As of January 2, 2021,2022, participants who have attained age 50 and who have completed at least 3 years of participation in the ESOP are permitted to diversify a portion of their respective ESOP accounts over a period of 11 years. For each of the 11 plan years that a participant is allowed to diversify his or her accounts, the participant is permitted to diversify up to 50% of the value (as of the last day of the preceding plan year) of their vested diversification eligible ESOP account. This diversification election applies only to shares acquired by the ESOP after 1987, or the Diversification Eligible Shares. Shares acquired by the ESOP prior to 1987 are not eligible for this diversification election. In total, as of December 31, 2020, the ESOP held 19,241,796.9158 Diversification Eligible Shares. However, only 4,239,243.6523 shares are eligible for diversification in 2021. In January 2021, the Board approved an amendment to the ESOP which, for diversifications processed after January 1, 2021, will permit qualified participants to generally be permitted to direct the ESOP as to diversification of 50% of the value of the vested portion of the Participant’s ESOP account. The definition of such a qualified Participant shall mean a Participant who has attained the age of 50 and who has completed at least 3 years of participation in the ESOP and other criteria.
ESOP distributions will be made in the form of shares of our common stock (other than distributions in respect of fractional shares, which will be made in cash) and will be available for sale into the public market, subject to compliance with applicable federal securities laws.
60
Pay Versus Performance Table
The following table sets forth additional compensation information of our Chief Executive Officer (CEO) and our other NEOs along with our total shareholder return, the total shareholder return of the peer group identified below, our net income, and revenue, our company selected measure, for our fiscal years ending in 2020, 2021, 2022 and 2023:
|
|
|
|
|
|
|
|
|
|
|
|
|
|
|
|
| Value of Initial Fixed $100 Investment Based On: |
| (in thousands) | |||||||||||||||||
Year | Summary | Compensation | Summary | Compensation | Average | Average | Total | Peer Group | Net | Revenue | ||||||||||||||||||||||||||
2023 |
|
| 18,596,895 |
|
| 25,548,246 (4) |
|
|
|
|
|
|
| 2,160,582 |
|
| 3,296,957 (4) |
|
| 151.91 |
|
|
| 165.65 |
|
|
|
| 161,149 |
|
|
| 5,442,749 |
|
| |
2022 |
|
| 6,973,806 |
|
| 10,626,325 (5) |
|
|
|
|
|
|
| 1,945,846 |
|
| 3,331,189 (5) |
|
| 112.04 |
|
|
| 142.59 |
|
|
|
| 96,664 |
|
|
| 4,195,272 |
|
| |
2021 |
|
| 5,348,118 |
|
| 4,077,659 (6) |
|
| 7,119,599 |
|
| 3,822,001 (6) |
|
| 1,498,734 |
|
| 864,158 (6) |
|
| 81.52 |
|
|
| 139.03 |
|
|
|
| 64,072 |
|
|
| 3,660,771 |
|
|
2020 |
|
|
|
|
|
|
| 8,231,959 |
|
| 2,601,283 (7) |
|
| 2,507,932 |
|
| 1,676,265 (7) |
|
| 88.20 |
|
|
| 115.30 |
|
|
|
| 98,541 |
|
|
| 3,918,946 |
|
| |
COMPENSATION COMMITTEE REPORT ON EXECUTIVE
COMPENSATION
The Compensation Committee has reviewed and discussed the CD&A
Year |
| CEO#2 | Other NEOs |
2023 |
| Susan M. Balaguer, Michael R. Kolloway and Matthew Ofilos | |
2022 |
| Susan M. Balaguer, George L. Ball, Charles L. Harrington, Michael R. Kolloway and Matthew Ofilos | |
2021 |
| Charles L. Harrington | George L. Ball, Debra A. Fiori and Michael R. Kolloway |
2020 |
| Charles L. Harrington | George L. Ball, Debra A. Fiori, Michael R. Kolloway and Carey A. Smith |
| CEO#1 | Average | ||
Total Reported in 2023 Summary Compensation Table (SCT) | 18,596,895 |
| 2,160,582 |
|
Less, value of Stock Awards reported in SCT | (15,215,909) |
| (872,752) |
|
Plus, Year-End value of Awards Granted in Fiscal Year that are Unvested and Outstanding | 17,670,848 |
| 1,255,989 |
|
Plus, Change in Fair Value of Prior Year awards that are Outstanding and Unvested | 4,516,447 |
| 731,953 |
|
Plus, FMV of Awards Granted this Year and that Vested this Year | — |
| — |
|
Plus, Change in Fair Value (from prior year-end) of Prior Year awards that Vested this year | (20,035) |
| 21,186 |
|
Less Prior Year Fair Value of Prior Year awards that Failed to vest this year | — |
| — |
|
Total Adjustments | 6,951,351 |
| 1,136,375 |
|
Compensation "Actually Paid" for Fiscal Year 2023 | 25,548,246 |
| 3,296,957 |
|
61
| CEO#1 | Average | ||
Total Reported in 2022 Summary Compensation Table (SCT) | 6,973,806 |
| 1,945,846 |
|
Less, value of Stock Awards reported in SCT | (4,730,700) |
| (990,085) |
|
Plus, Year-End value of Awards Granted in Fiscal Year that are Unvested and Outstanding | 6,577,029 |
| 1,239,181 |
|
Plus, Change in Fair Value of Prior Year awards that are Outstanding and Unvested | 1,736,210 |
| 570,784 |
|
Plus, FMV of Awards Granted this Year and that Vested this Year | — |
| 326,744 |
|
Plus, Change in Fair Value (from prior year-end) of Prior Year awards that Vested this year | 69,980 |
| 238,720 |
|
Less Prior Year Fair Value of Prior Year awards that Failed to vest this year | — |
| — |
|
Total Adjustments | 3,652,519 |
| 1,385,343 |
|
Compensation "Actually Paid" for Fiscal Year 2022 | 10,626,325 |
| 3,331,189 |
|
| CEO#1 | CEO#2 | Average | |||
Total Reported in 2021 Summary Compensation Table (SCT) | 5,348,118 |
| 7,119,599 |
| 1,498,734 |
|
Less, value of Stock Awards reported in SCT | (3,895,113) |
| (5,382,006) |
| (829,496) |
|
Plus, Year-End value of Awards Granted in Fiscal Year that are Unvested and Outstanding | 3,339,277 |
| 4,853,848 |
| 748,094 |
|
Plus, Change in Fair Value of Prior Year awards that are Outstanding and Unvested | (618,697) |
| (2,264,902) |
| (215,544) |
|
Plus, FMV of Awards Granted this Year and that Vested this Year | — |
| — |
| — |
|
Plus, Change in Fair Value (from prior year-end) of Prior Year awards that Vested this year | (95,926) |
| (504,539) |
| (337,629) |
|
Less Prior Year Fair Value of Prior Year awards that Failed to vest this year | — |
| — |
| — |
|
Total Adjustments | (1,270,459) |
| (3,297,598) |
| (634,576) |
|
Compensation "Actually Paid" for Fiscal Year 2021 | 4,077,659 |
| 3,822,001 |
| 864,158 |
|
|
| CEO#2 | Average | ||
Total Reported in 2020 Summary Compensation Table (SCT) |
| 8,231,959 |
| 2,507,932 |
|
Less, value of Stock Awards reported in SCT |
| (4,974,490) |
| (1,221,932) |
|
Plus, Year-End value of Awards Granted in Fiscal Year that are Unvested and Outstanding |
| 4,626,904 |
| 1,104,283 |
|
Plus, Change in Fair Value of Prior Year awards that are Outstanding and Unvested |
| (4,069,659) |
| (569,652) |
|
Plus, FMV of Awards Granted this Year and that Vested this Year |
| — |
| — |
|
Plus, Change in Fair Value (from prior year-end) of Prior Year awards that Vested this year |
| (1,213,431) |
| (144,365) |
|
Less Prior Year Fair Value of Prior Year awards that Failed to vest this year |
| — |
| — |
|
Total Adjustments |
| (5,630,676) |
| (831,667) |
|
Compensation "Actually Paid" for Fiscal Year 2020 |
| 2,601,283 |
| 1,676,265 |
|
62
The only changes to the peer group in 2023 relative to 2022 was the removal of Maxar Technologies Inc and ManTech International Corporation as a result of their acquisitions. In 2022, the only change to the peer group relative to 2021 was the removal of Cubic Corporation as a result of its acquisition. 3-year TSR for the peer group approved in 2021, assuming a $100 initial investment on 12/31/2019, would have been $141.75. Changes to the peer group made in 2021 relative to the 2020 peer group were the removals of FLIR Systems and Perspecta as a result of their acquisitions and the addition of Maxar in light of its business relevance and size. 2-year TSR for the peer group approved in 2020, assuming a $100 initial investment on 12/31/2019, would have been $135.62.
Performance Measures
The following performance measures reflect the Company’s most important performance measures in effect for 2023, as further described and defined in the Compensation Discussion and Analysis under How We Performed in Fiscal 2023, Annual Cash Incentives and Long-Term Incentives.
Revenue: Revenue as reported in financial statements, which excludes equity in earnings from unconsolidated joint ventures and bad debt expense.
Adjusted EBITDA: Earnings attributable to Parsons Corporation, adjusted to include earnings attributable to noncontrolling interests and to exclude interest expense (net of interest income), provision for income taxes, depreciation and amortization and certain other items that are not considered in the evaluation of ongoing operating performance. These other items include earnings attributable to noncontrolling interests, asset impairment charges, income and expense recognized on litigation matters, expenses incurred in connection with acquisitions and other non-recurring transaction costs and expenses related to restructuring. |
Awards: Awards booked into backlog generally represent the amount of revenue, excluding equity in earnings, expected to be earned in the future from funded and unfunded contract awards received during the period. Contract awards include both new and re-compete contracts and task orders. |
Cash Flow: Represents cash flow from operating activities as presented in the financial statements. |
Diversity: Global Gender and US Race/Ethnic representation. |
Relationship Between Compensation “Actually Paid” and Performance Measures
The table below reflects the relationship between the Compensation "Actually Paid" for each individual serving as CEO and the average of other NEOs and the performance measures shown in the pay versus performance table from 2020 to 2023:
We believe the Compensation “Actually Paid” in each of the years reported above and over the four-year cumulative period are reflective of the Compensation Committee’s emphasis on “pay-for-performance” as the Compensation “Actually Paid” fluctuated year-over-year and in relation to Summary Compensation Table pay, primarily as a result of our stock performance and our varying levels of achievement against pre-established performance goals under our Annual Program and our LTI Program, including our Revenue.
63
Relationship Between Compensation “Actually Paid” to our CEO and the Average of the Compensation “Actually Paid” to the Other NEOs and the Company’s Cumulative TSR.
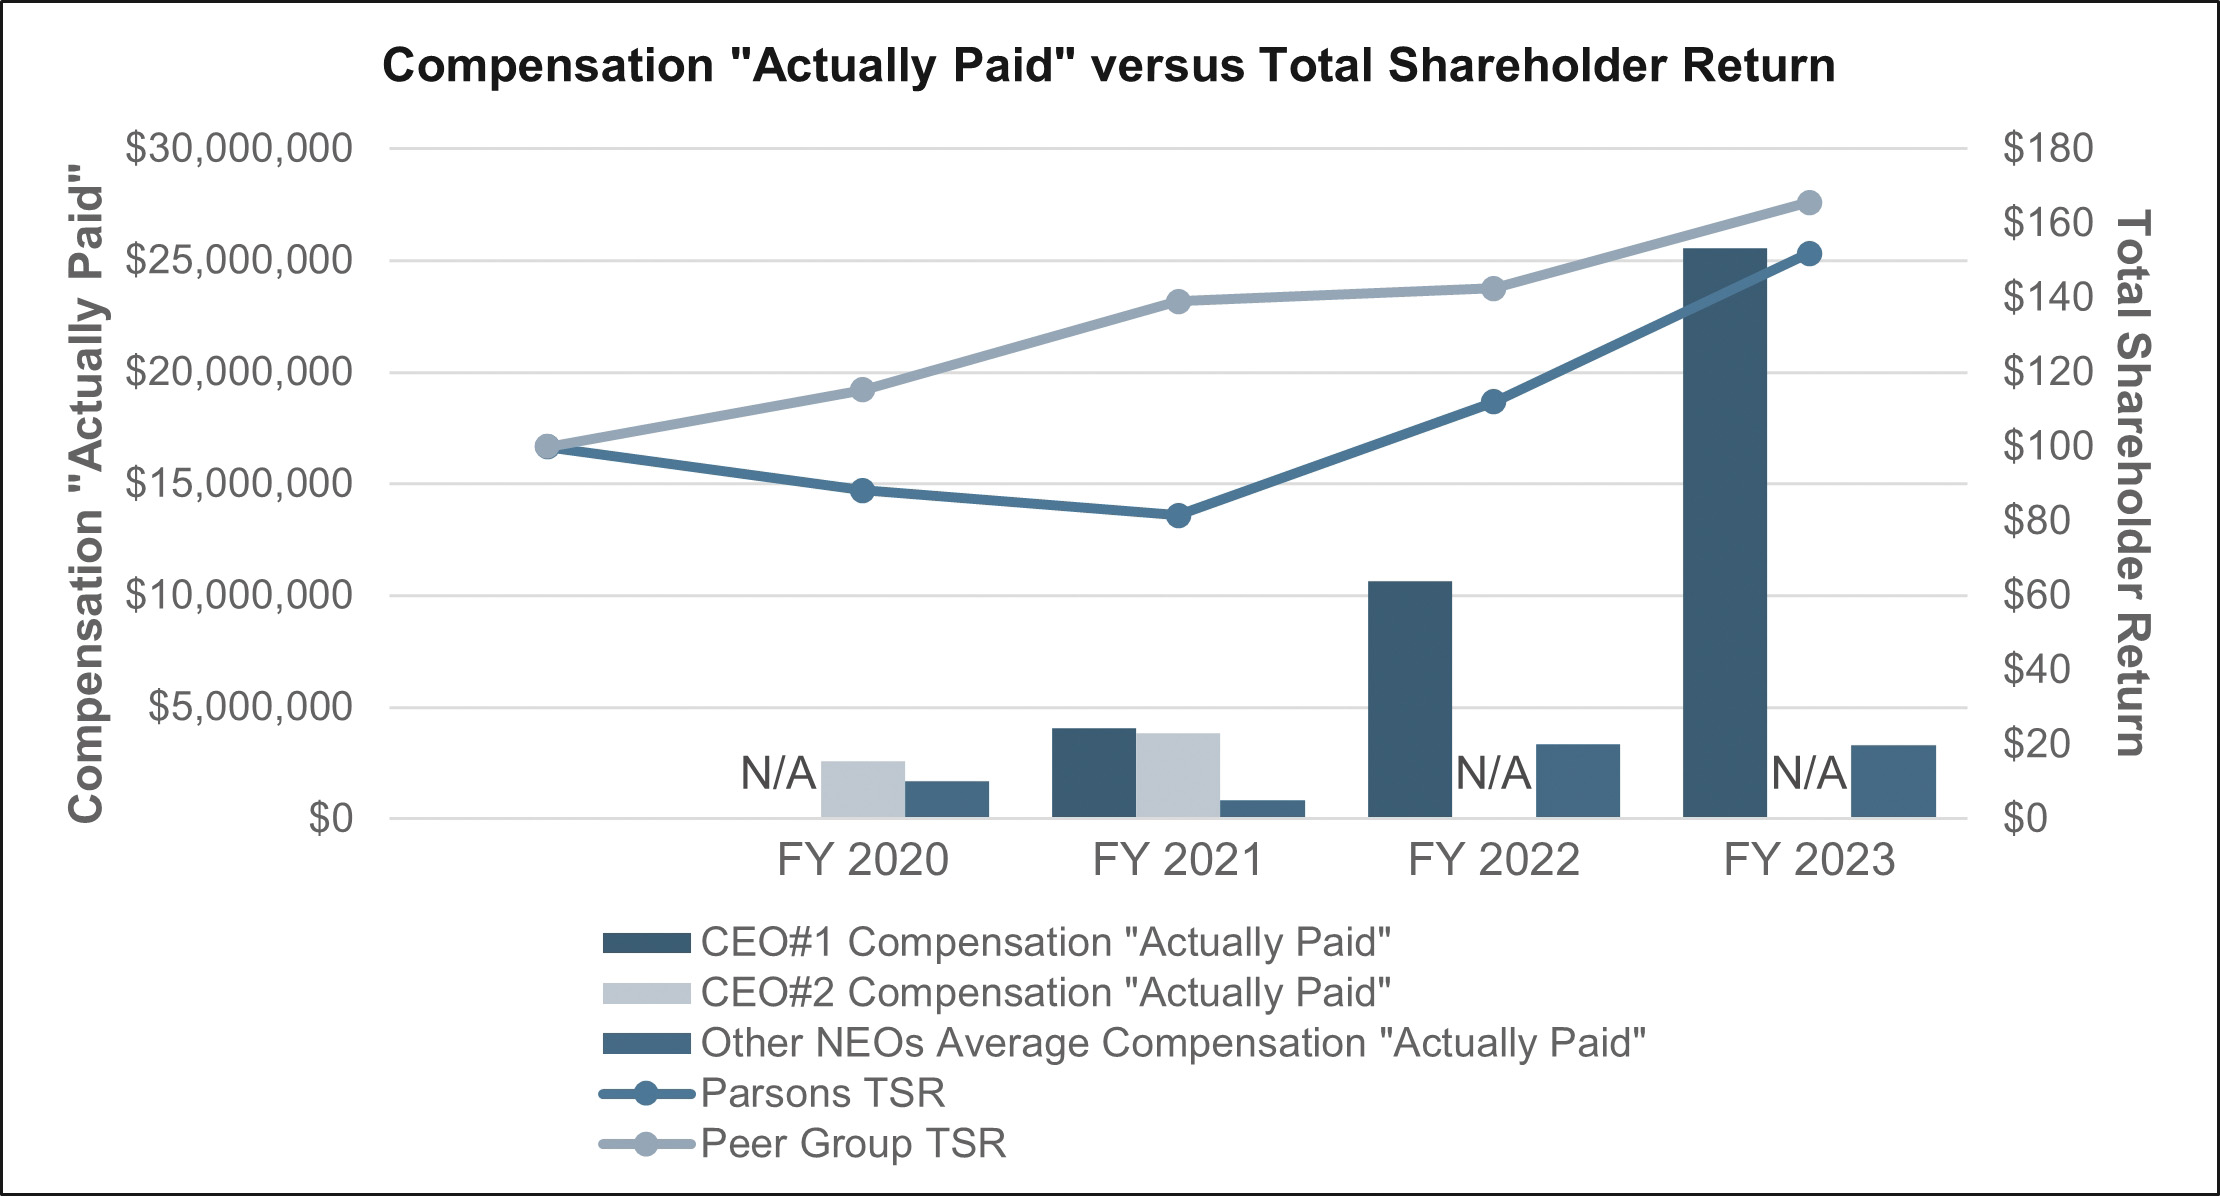
For 2020 and 2021, the Compensation “Actually Paid” to CEO #2 (Mr. Harrington) was 68% and 46% lower than Summary Compensation Table pay, while our TSR in each year was -12% and -8%. The average of the Compensation “Actually Paid” to the Other NEOs in 2020 and 2021 was 33% and 42% lower than the average Summary Compensation Table value. For 2022 and 2023, the Compensation “Actually Paid” to CEO #1 (Ms. Smith) increased by 52% and 37% relative to Summary Compensation Table pay, while our TSR in each year was +37% and +36%. Average Compensation “Actually Paid” to our NEOs was 71% and 53% higher than the average Summary Compensation Table value in 2022 and 2023.
Relationship Between Compensation “Actually Paid” to our CEO and the Average of the Compensation “Actually Paid” to the Other NEOs and the Company’s Net Income. For 2020 and 2021, the Compensation “Actually Paid” to CEO #2 (Mr. Harrington) was 68% and 46% lower than Summary Compensation Table pay, while our net income growth in each year was -18% and -35%. The average of the Compensation “Actually Paid” to the Other NEOs in 2020 and 2021 was 33% and 42% lower than the average Summary Compensation Table value. For 2022 and 2023, our Compensation “Actually Paid” to CEO #1 (Ms. Smith) increased by 52% and 37% relative to Summary Compensation Table pay, alongside an increase in net income of 51% and 67%. Average Compensation “Actually Paid” to our NEOs was 71% and 53% higher than the average Summary Compensation Table value in 2022 and 2023.
64
Relationship Between Compensation “Actually Paid” to our CEO and the Average of the Compensation “Actually Paid” to the Other NEOs and the Company’s Revenue. For 2020 and 2021, the Compensation “Actually Paid” to CEO #2 (Mr. Harrington) was 68% and 46% lower than Summary Compensation Table pay, while our revenue growth in each year was -1% and -7%. The average of the Compensation “Actually Paid” to the Other NEOs in 2020 and 2021 was 33% and 42% lower than the average Summary Compensation Table value. For 2022 and 2023, our Compensation “Actually Paid” to CEO #1 (Ms. Smith) increased by 52% and 37% relative to Summary Compensation Table pay, alongside an increase in revenue of 15% and 30%. Average Compensation “Actually Paid” to our NEOs was 71% and 53% higher than the average Summary Compensation Table value in 2022 and 2023.
As a result, our Compensation “Actually Paid”, measured relative to Summary Compensation Table figures, has been directionally aligned with our performance over the timeframe that the table covers.
65
DIRECTOR COMPENSATION
Our Directors who are also our employees will not receive any additional compensation for their service on our Board, but we believe that attracting and retaining qualified non-employee Directors is critical to our future growth and governance.
The Compensation and Management Development Committee reviews non-employee Director compensation biennially. In July 2022, the Compensation and Management Development Committee reviewed non-employee Director pay practices of our peer group. For information on our peer group, see Assessing Compensation Competitiveness in the Compensation Discussion and Analysis. No changes were made following the July 2022 review for 2023.
Cash Compensation. Effective for 2020,2023, our non-employee Directors were eligible to receive the following cash compensation:
Component |
| Annual Amount |
|
| Annual Amount |
| ||
Annual Board Retainer |
| $ | 100,000 |
|
| $ | 100,000 |
|
Annual Lead Independent Director Additional Retainer |
| $ | 35,000 |
|
| $ | 35,000 |
|
Audit and Risk Committee Chair Additional Retainer |
| $ | 20,000 |
|
| $ | 20,000 |
|
Audit and Risk Committee Member Additional Retainer |
| $ | 11,500 |
|
| $ | 11,500 |
|
Compensation Committee Chair Additional Retainer |
| $ | 18,000 |
| ||||
Compensation Committee Member Additional Retainer |
| $ | 8,000 |
| ||||
Compensation and Management Development Committee Chair Additional Retainer |
| $ | 18,000 |
| ||||
Compensation and Management Development Committee Member Additional Retainer |
| $ | 8,000 |
| ||||
Corporate Governance and Responsibility Committee Chair Additional Retainer |
| $ | 15,000 |
|
| $ | 15,000 |
|
Corporate Governance and Responsibility Committee Member Additional Retainer |
| $ | 8,000 |
|
| $ | 8,000 |
|
Special Meeting Fees (Per Meeting) |
| $2,000 (in person) $1,000 (telephonic) |
| |||||
Commencing in 2020, non-employeeNon-employee Directors wereare able to elect to receive all or a portion of their cash retainers (but not special meeting fees) in the form of fully vested shares of our common stock, which shares are issued on the first day of each calendar quarter, in advance (and, in the case of a newly-electednewly elected or appointed director,non-employee Director, on the first day of his or her service for the then-current quarter). The number of shares to be issued is equal to (1) the cash retainer to be paid in the form of shares, divided by (2) the 60 trading day weighted average of our common stock, up to and including the last day of the preceding calendar quarter, rounded up to the nearest whole share. These shares are issued under our 2019 Incentive Award Plan.
Our non-employee Directors are eligible to defer the cash compensation paid to them by us (and any shares issued in satisfaction of cash retainers as described above) under the Fee Deferral Plan for Outside Directors of the Parsons Corporation (the “Fee Deferral Plan”). The Fee Deferral Plan allows a non-employee directorDirector to defer his or her annual retainer (and any shares issued in satisfaction of cash retainers as described above) until his or her termination of service or, if earlier, death. Deferred fees (or shares) will generally be payable in a lump sum or in five or ten installments. In the event of a change in control of the Company, all balances will be paid in a lump sum upon the change in control or as soon as practicable thereafter. Any shares deferred pursuant to such a deferral election will be issued in the form of a deferred fee award consisting of a number of restricted stock units under the Incentive Plan determined in accordance with the formula above and reflecting the director’snon-employee Director’s deferral election.
66
Long-Term Incentive Compensation. The non-employee Directors are granted time-based RSUs under the 2019 Incentive Award Plan, as follows:
Plan. On January 1, 2020 and April 1, 2020, each non-employee director was granted such number of RSUs as is equal to (1) $40,000 divided by (2) the 60 trading day weighted average of our
|
From and after the date of the 2020 annual stockholders’ meeting, on the date of each annual stockholders’ meeting, each non-employee directorDirector will be granted such number of RSUs as is equal to (1) $160,000 (plus, with respect to the 2020 annual meeting, a prorated quarterly target dollar amount for the portion of the second quarter of 2020 preceding the date of the annual meeting),$170,000, divided by (2) the 60 trading60-trading day weighted average of our common stock, up to and including the last day preceding the grant date, rounded up to the nearest whole share.
In October 2022, the Board amended the Non-Employee Director Compensation Policy to include eligibility of a pro-rated initial time-based RSU grant for non-employee Directors who join the Board at a time other than at the annual stockholder’s meeting. In such case, the new non-employee Director will be granted a number of initial restricted stock units equal to the amount of (1) the annual target dollar amount, multiplied by (2) a fraction with i) a numerator equal to the number of whole calendar months between the date of the non-employee Director’s initial election or appointment to the Board and the date of the next annual stockholder’s meeting, and ii) a denominator equal to 12, divided by (3) the 60 Trading Day Weighted Average Stock Price for the Determination Period up to and including the last day preceding the date of grant, rounded up to the nearest whole share. The restricted stock unit award will vest on the same date as the vesting schedule of the immediately preceding annual awards granted to the other continuing non-employee Directors, provided that the non-employee Director is then serving as a member of the Board of Directors. Company executives transitioning to a non-employee Director role are ineligible for the prorated initial grant.
Except as described above for a prorated initial grant, RSUs will vest on the first anniversary of the date of grant. The RSUs will also vest upon a change in control (as defined in the 2019 Incentive Award Plan), or a non-employee director’sDirector’s death or disability. Commencing inIn the case of retirement from the Board, for RSUs granted from and after April 21, 2020, the non-employee Director’s RSUs will accelerate and vest in a prorated portion of the RSUs scheduled to vest on the next annual vesting date, based on the portion of days that has elapsed since the grant date. The non-employee Directors willare also be eligible to make deferral elections with respect to such RSUs, with the deferral alternatives under the Fee Deferral Plan.
In April 2020, the Board approved the accelerated vesting of the outstanding RSUs held by Mr. Dahlberg in connection with his retirement from the Board, and Ms. Lundgren in connection with her departure from the Board, on April 21, 2020, and the amendment to existing Non-Employee Director Compensation Policy to provide for the prorated accelerated vesting of RSUs granted from and after April 21, 2020 to members of the Board upon their retirement from the Board.
The Compensation Committee reviews non-employee director compensation biennially. In July 2020, the Compensation Committee reviewed non-employee director pay practices of our peer group. For information on our peer group, see Assessing Compensation Competitiveness in the Compensation Discussion and Analysis. No changes were made following the July 2020 review.
We adopted stock ownership guidelines in January 2020, as theThe Board believes that it is important to link the interests of non-employee Directors to those of our stockholders. The stock ownership guidelines require our non-employee Directors to accumulate and hold a minimum number of shares of Parsons common stock within five years of the later of (1) the effective date of the policy or (2) the date of appointment to the Board. The specific Parsons stock ownership guidelines for our non-employee Directors is 5X their annual retainer.
For our non-employee Directors, shares of our common stock that count towards satisfaction of this guideline include (1) common stock directly owned by the non-employee directorDirector or immediate family member (2) common stock owned indirectly if the individual has an economic interest in the shares (beneficial ownership as defined in Rule 13d-3 and reported in the proxy) (3) unvested restricted stock or RSUs, and (4) vested units held in deferral accounts under the Share Value Retirement Plan (“SVRP”),SVRP, which was a plan under which non-employee Directors received grants (similar to phantom equity) prior to IPO.
Value of ownership will be measured by reference to the trailing 60 trading day weighted average of the Parsons common stock, up to and including last day of the calendar year; compliance will be evaluated annually.
67
Our non-employee Directors are currently in compliance, either by meeting their non-employee Director ownership requirement, or Directors by having made sufficient progress toward their ownership requirement based on time in role.
The following table contains information concerning the compensation of our non-employee Directors in fiscal 2020.2023.
DIRECTOR COMPENSATION TABLE |
| |||||||||||||||||||
Name |
| Fees Earned |
|
| Stock |
|
| Change in |
|
| All Other |
|
| Total ($) |
| |||||
George L. Ball(4) |
|
| 100,000 |
|
|
| 181,559 |
|
|
| — |
|
|
| 5,000 |
|
|
| 286,559 |
|
Mark K. Holdsworth |
|
| 116,000 |
|
|
| 178,988 |
|
|
| — |
|
|
| 5,000 |
|
|
| 299,988 |
|
Steven F. Leer |
|
| 164,500 |
|
|
| 178,988 |
|
|
| — |
|
|
| 5,000 |
|
|
| 348,488 |
|
Letitia A. Long |
|
| 119,500 |
|
|
| 178,988 |
|
|
| — |
|
|
| 5,000 |
|
|
| 303,488 |
|
Ellen Lord |
|
| 116,000 |
|
|
| 178,988 |
|
|
| — |
|
|
| 5,000 |
|
|
| 299,988 |
|
General Darren W. McDew, USAF (ret) |
|
| 116,000 |
|
|
| 178,988 |
|
|
| — |
|
|
| 5,000 |
|
|
| 299,988 |
|
Harry T. McMahon |
|
| 119,500 |
|
|
| 178,988 |
|
|
| — |
|
|
| — |
|
|
| 298,488 |
|
M. Christian Mitchell |
|
| 128,000 |
|
|
| 178,988 |
|
|
| — |
|
|
| 5,000 |
|
|
| 311,988 |
|
Major General Suzanne M. Vautrinot, USAF (ret) |
|
| 126,500 |
|
|
| 178,988 |
|
|
| — |
|
|
| 5,000 |
|
|
| 310,488 |
|
David C. Wajsgras(3)(4) |
|
| 119,500 |
|
|
| 182,080 |
|
|
| 700 |
|
|
| — |
|
|
| 302,280 |
|
DIRECTOR COMPENSATION TABLE |
| |||||||||||||||
Name |
| Fees Earned or Paid in Cash ($) |
|
| Stock Awards ($) (1) |
|
| Change in Pension Value and Nonqualified Deferred Compensation Earnings ($) |
|
| Total ($) |
| ||||
Kenneth C. Dahlberg (2) |
|
| 59,750 |
|
|
| 84,949 |
|
|
| — |
|
|
| 144,699 |
|
Mark K. Holdsworth |
|
| 122,000 |
|
|
| 238,810 |
|
|
| — |
|
|
| 360,810 |
|
Steven F. Leer |
|
| 128,500 |
|
|
| 238,810 |
|
|
| — |
|
|
| 367,310 |
|
Letitia A. Long (3) |
|
| 94,625 |
|
|
| 153,861 |
|
|
| — |
|
|
| 248,486 |
|
Tamara L. Lundgren (2) |
|
| 59,000 |
|
|
| 84,949 |
|
|
| — |
|
|
| 143,949 |
|
General Darren W. McDew, USAF (ret) (4) |
|
| 62,000 |
|
|
| 156,675 |
|
|
| — |
|
|
| 218,675 |
|
James F. McGovern (5) |
|
| 147,000 |
|
|
| 238,810 |
|
|
| 27,379 |
|
|
| 413,189 |
|
Harry T. McMahon |
|
| 124,500 |
|
|
| 238,810 |
|
|
| — |
|
|
| 363,310 |
|
M. Christian Mitchell |
|
| 135,000 |
|
|
| 238,810 |
|
|
| — |
|
|
| 373,810 |
|
Major General Suzanne M. Vautrinot, USAF (ret) |
|
| 123,750 |
|
|
| 238,810 |
|
|
| — |
|
|
| 362,560 |
|
David C. Wajsgras (4)(5)(6) |
|
| 62,750 |
|
|
| 156,675 |
|
|
| 9 |
|
|
| 219,434 |
|
68
Name |
|
| ||
|
|
|
|
|
|
|
|
|
|
|
| |||
|
| |||
Mark K. Holdsworth |
| |||
Steven F. Leer |
| |||
Letitia Long |
| |||
|
| |||
General Darren W. McDew, USAF (ret) |
| |||
|
| |||
|
| |||
|
| |||
Major General Suzanne M. Vautrinot, USAF (ret) |
| |||
David C. Wajsgras |
| |||
EQUITY COMPENSATIONCOMPENSATION PLAN INFORMATION
The following table provides information as of December 31, 20202023 regarding compensation plans under which our equity securities are authorized for issuance.
Plan Category | Number of Securities
| Weighted-Average
| Number of Securities
| |||||||||||||
Equity compensation
| — |
| — |
| 1,463,790 (2) | |||||||||||
Equity compensation
|
|
| — |
| ||||||||||||
8,238,003 (4) | ||||||||||||||||
69
|
|
|
|
|
|
|
|
AUDIT AND RISK COMMITTEECOMMITTEE REPORT
The Audit and Risk Committee is composed of five Directors identified below, each of whom is an independent Director as defined by the applicable SEC directors rules and the NYSE listing standards. Mr. Mitchell, the Chair of the Audit and Risk Committee, Mr. Leer and Mr. Wajsgras have been designated by the Board as “audit committee financial experts” under applicable SEC rules. The following is the report of the Audit and Risk Committee with respect to the Company’s audited financial statements as of and for the year ended December 31, 20202023 and the notes thereto.
The Audit and Risk Committee is responsible for assisting the Board in fulfilling its oversight responsibilities relating to, among other things, the Company’s accounting, auditing, and financial reporting processes, internal controls, compliance with legal and regulatory requirements and its code of ethics and risk management, as discussed more fully in the Audit and Risk Committee charter, a copy of which is available on our website, www.parsons.com. In accordance with its charter, the Audit
and Risk Committee appoints the Company’s independent registered public accounting firm, PwC, subject to stockholder ratification, and conducts an annual review of its performance. In addition, the Audit and Risk Committee pre-approves all audit and permissible non-audit services provided by PwC, and the fees for those services. The Audit and Risk Committee also oversees the Company’s internal audit function, including its annual audit plan, budget, and staffing. As part of its oversight role, the Audit and Risk Committee meets throughout the year, separately and together, with each of management, the Company’s internal auditors, and PwC.
Management has the primary responsibility for the Company’s financial statements and accounting and reporting processes, including the systems of internal accounting control. PwC is responsible for performing an independent audit of the consolidated financial statements in accordance with the standards of the Public Company Accounting Oversight Board (“PCAOB”), and rendering opinions on whether the financial statements are in conformity with accounting principles generally accepted in the United States and the effectiveness of the Company’s internal control over financial reporting.
The Audit and Risk Committee has reviewed and discussed with management of the Company and PwC, the audited consolidated financial statements of the Company for the year ended December 31, 20202023 (the “Audited Financial Statements”), and their assessment of the effectiveness of internal control over financial reporting. The Audit and Risk Committee also reviewed any significant audit findings identified by PwC, and those identified by the Company’s internal auditors as well as management’s responses thereto. In addition, the Audit and Risk Committee discussed with PwC the matters required to be discussed under PCAOB Auditing Standard No. 1301, Communications with Audit Committees.
The Audit and Risk Committee has also: (i) considered whether non-audit services provided by PwC are compatible with its independence; (ii) received the written disclosures and the letter from PwC required by the applicable requirements of the PCAOB regarding PwC’s communications with the Audit and Risk Committee concerning independence; and (iii) discussed with PwC its independence.
70
Based on the reviews and discussions described above, the Audit and Risk Committee recommended to the Board that the Audited Financial Statements be included in our Annual Report on Form 10-K for the year ended December 31, 20202023 for filing with the SEC.
THE AUDIT AND RISK COMMITTEE | |
M. Christian Mitchell (Chair) | |
Steven F. Leer Letitia A. Long Harry T. McMahon Suzanne M. Vautrinot David C. Wajsgras | |
PRE-APPROVAL OF SERVICES BY INDEPENDENTINDEPENDENT REGISTERED ACCOUNTING FIRM
The Audit and Risk Committee pre-approves all audit, audit-related, tax, and other services performed by our independent auditors. The Audit and Risk Committee pre-approves specific categories of services up to pre-established fee thresholds. Unless the type of service had previously been pre-approved, the Audit and Risk Committee must approve that specific service before the independent auditors may perform it. In addition, separate approval is required if the amount of fees for any pre-approved category of service exceeds the fee thresholds established by the Audit and Risk Committee. The Audit and Risk Committee has delegated to the chair of the Committee pre-approval authority with respect to permitted services, provided that the chair must report any pre-approval decisions to the Audit and Risk Committee at its next scheduled meeting. All fees described below were pre-approved by the Audit and Risk Committee.
INDEPENDENT REGISTERED PUBLICPUBLIC ACCOUNTING FIRM FEES
The following table presents the Company’s fees for services performed by its principal accounting firm, PwC, during fiscal years 20202023 and 2019.2022.
(Amounts in thousands) |
| 2023 |
|
| 2022 |
| ||
Audit fees (1) |
| $ | 5,086 |
|
| $ | 5,289 |
|
Audit-related fees |
|
| — |
|
|
| — |
|
Tax fees (2) |
|
| — |
|
|
| 10 |
|
All other fees (3) |
|
| 23 |
|
|
| 22 |
|
Total |
| $ | 5,109 |
|
| $ | 5,321 |
|
(Amounts in thousands) |
| 2020 |
|
| 2019 |
| ||
Audit fees(1) |
| $ | 5,548 |
|
| $ | 4,676 |
|
Audit-related fees(2) |
|
| — |
|
|
| — |
|
Tax fees(3) |
|
| — |
|
|
| — |
|
All other fees |
|
| 12 |
|
|
| 5 |
|
Total |
| $ | 5,560 |
|
| $ | 4,681 |
|
71
|
|
|
|
|
|
PROPOSAL 2: RATIFICATION OF APPOINTMENT OF ACCOUNTANTS
The Audit and Risk Committee has appointed PwC as the independent auditors to perform an integrated audit of the Company for the year ending December 31, 2021.2024. PwC served as our independent auditors for the year ended December 31, 2020.2023. Stockholder approval of the appointment is not required.
The Board believes that obtaining stockholder ratification of the appointment is a sound corporate governance practice. If the stockholders do not vote on an advisory basis in favor of PwC, the Audit and Risk Committee will reconsider whether to hire the firm and may retain PwC or hire another firm without resubmitting the matter for stockholders to approve. The Audit and Risk Committee retains the discretion at any time to appoint a different independent auditor.
Representatives of PwC are expected to be present at the annual meeting, available to respond to appropriate questions, and will have the opportunity to make a statement if they desire.
The Board of Directors recommends a vote FOR ratification of the appointment of PricewaterhouseCoopers LLP as the independent registered public accounting firm for the Company for fiscal year |
72
PROPOSAL 3: ADVISORY VOTE ON COMPANY’S EXECUTIVE COMPENSATION
As required by Section 14A of the Exchange Act, the Company is providing stockholders with a non-binding advisory vote on the compensation of our named executive officers, as disclosed in the CD&A, the accompanying compensation tables, and the related narrative disclosure in this proxy statement. Although this vote is advisory, the Board and the Compensation and Management Development Committee value the opinions of our stockholders and will review and consider the voting results when making future compensation decisions for our named executive officers.
As described in detail under the CD&A, our compensation programs are designed to attract, motivate, and retain executives of outstanding ability to meet and exceed the demands of our clients, focus management on optimizing stockholder value and fostering an ownership culture, create appropriate rewards for outstanding performance and penalties for underperformance, and provide competitive rewards that foster collaboration by rewarding executives for their contribution to our overall performance and financial success while determining and allocating incentives based on our performance as a whole in recognition of the spirit and culture of collaboration that has defined us throughout our history. Accordingly, the Board submits the following resolution for a stockholder vote at the 20202024 Annual Meeting:
RESOLVED, that the stockholders approve, on an advisory basis, the compensation of the Company’s named executive officers as disclosed in the CD&A, the accompanying compensation tables, and the related narrative disclosure in the Company’s proxy statement for the 20212024 Annual Meeting.
The Board of Directors recommends a vote FOR the approval, on an advisory basis, of the compensation of our named executive officers as disclosed in the Compensation Discussion & Analysis of this proxy statement. |
73
OTHER BUSINESS
The Board is not aware of any other matters to be presented at the annual meeting. If any other matter proper for action at the meeting should be presented, the holders of the accompanying proxy will vote the shares represented by the proxy on such matter in accordance with their best judgment. If any matter not proper for action at the meeting should be presented, the holders of the proxy will vote against consideration of the matter or the proposed action.
By order of the Board of Directors,
By order of the Board of Directors | |
Carey A. Smith, Chair | |
Chantilly, Virginia March 3, 2024 |
Charles L. Harrington
Centreville, Virginia74
March 10, 2021
IMPORTANT INFORMATION ABOUT ANNUALANNUAL MEETING AND PROXY PROCEDURES
The Board is soliciting proxies to be used at the Annual Meeting of Stockholders to be held on April 20, 2021,16, 2024, beginning at 9:00 a.m. (EDT). The meeting will be held virtually at virtualshareholdermeeting.com/PSN2021.PSN2024.
Why am I receiving these proxy materials?
You have received these proxy materials because our Board is soliciting your proxy to vote your shares at the annual meeting. As a stockholder, you are invited to attend the annual meeting and are requested to vote on the items of business described in this proxy statement. This proxy statement includes information that we are required to provide to you under SEC rules and describes issues on which we would like you to vote at our Annual Meeting of Stockholders. It also gives you information on these issues so that you can make an informed decision. The proxy materials include our proxy statement for the annual meeting, our annual report to stockholders, which includes our Annual Report on Form 10-K for the year ended December 31, 20202023 and the proxy card, or a voting instruction card, for the annual meeting.
Our Board has made this proxy statement and proxy card available to you on the Internet because you own shares of Class A common stock of the Company.
If you submit a proxy by using the Internet, by calling or by signing and returning the proxy card, you will appoint Charles L. HarringtonCarey A. Smith and Michael R. Kolloway (with full power of substitution) as your representatives at the annual meeting. They will vote your shares at the annual meeting as you have instructed them or, if an issue that is not on the proxy card comes up for vote, in accordance with his or her best judgment. By submitting a proxy, you can ensure your shares will be voted whether or not you attend the annual meeting. Even if you plan to attend the virtual annual meeting, we encourage you to submit a proxy in advance by using the Internet, by calling or by signing and returning your proxy card. If you vote by Internet or by calling, you do not need to return your proxy card.
Why did I receive a one-page notice in the mail regarding the Internet availability of proxy materials instead of a full set of proxy materials?
Pursuant to the “Notice and Access” rules adopted by the SEC, we have elected to provide access to our proxy materials over the Internet at www.proxyvote.com. Accordingly, we are sending a Notice
of Internet Availability of Proxy Materials to our stockholders. All stockholders will have the ability to access the proxy materials on the website referred to in the Notice of Internet Availability of Proxy Materials or request to receive an electronic copy or printed set of the proxy materials. Instructions on how to access the proxy materials over the Internet or to request an electronic copy or printed copy may be found in the Notice of Internet Availability of Proxy Materials. In addition, stockholders may request to receive proxy materials in printed form by mail or electronically by email on an ongoing basis if you submit your request in writing at proxyvote.com, or by email to sendmaterial@proxyvote.com,, or by phone at 1-800-579-1639. We encourage stockholders to take advantage of the availability of the proxy materials on the Internet to help reduce the impact to the environment.
75
How do I attend the virtual annual shareholders’stockholders’ meeting?
Information for attending the virtual annual meeting are provided in the Notice Regarding the Availability of Proxy Materials sent to all stockholders of record as of February 19, 2021.20, 2024.
Who is entitled to vote at the annual meeting?
Holders of the Company’s common stock are entitled to vote at the annual meeting. The Board has established the record date for the annual meeting as February 19, 2021.20, 2024. Only holders of record of the Company’s common stock on the record date are entitled to receive notice of the meeting and to vote at the meeting.
How many shares must be present to hold the annual meeting?
In order for us to lawfully conduct business at the annual meeting, the holders of stock representing a majority of the voting power of all shares issued and outstanding and entitled to vote at the meeting must be present in person or represented by proxy. This is referred to as a quorum.
How many shares may I vote?
On February 19, 2021, 102,360,66220, 2024, 105,829.579 shares of our common stock were outstanding. Each share of Class A common stock is entitled to one vote, and stockholders do not have the right to cumulate their votes for the election of Directors.
What am I voting on and what are the Board’s recommendations?
Proposal | Description | Board’s Voting
| Page | ||
No. 1 | Election of four director nominees | FOR each nominee |
| 7 | |
No. 2 | Ratification of appointment of PricewaterhouseCoopers LLP (“PwC”) as the Company’s independent registered accounting firm for fiscal year | FOR |
| 72 | |
No. 3 | A non-binding advisory vote on the compensation program for the Company’s named executive officers, as disclosed in the Compensation Discussion and Analysis (“CD&A”) of the proxy statement | FOR |
| 73 | |
What is the difference between holding shares as a stockholder of record and as a beneficial owner?
If your shares are registered directly in your name with the Company’s registrar and transfer agent, Computershare, you are considered a “stockholder of record” with respect to those shares. In this case, we mailed the proxy materials and our annual report to you directly.
If your shares are held in a brokerage account or bank, you are considered the “beneficial owner” of those shares, which are held in “street name.” In this case, the proxy materials and our annual report were forwarded to you by your broker or bank. As the beneficial owner, you have the right to direct your broker or bank how to vote your shares by following the voting instructions included in the mailing.
76
What is the procedure for voting?
If you are a stockholder of record of common stock, you can vote your shares at the annual meeting by attending the virtual meeting and completing a ballot pursuant to the instructions contained in the Notice provided to all stockholders of records as of February 19, 2021.20, 2024. The information is contained in the sections entitled “How to Access the Proxy Materials” and “How to Vote”. You can also give a proxy to be voted at the annual meeting in one of three ways: (1) over the telephone by calling a toll-free number provided on the enclosed proxy card, (2) electronically via the Internet as described in the enclosed proxy card, or (3) date, sign, and complete the proxy card and return it in the enclosed envelope, which requires no postage stamp if mailed in the United States.
Can I change my proxy?
You may revoke your proxy before it is voted at the annual meeting by delivering a signed revocation letter to the Secretary of the Company at 5875 Trinity Parkway #300, Centreville,14291 Park Meadow Drive, Suite 100, Chantilly, Virginia 20120,20151, or by submitting a new proxy, dated later than your first proxy, in one of the ways described in the answer to the previous question. If you are attending in person and have previously mailed your proxy card, you may revoke your proxy and vote in person at the meeting.
Can other matters be decided at the annual meeting?
The Board is not aware of any other matters to be presented at the annual meeting. If any other matter proper for action at the meeting should be presented, the holders of the accompanying proxy will vote the shares represented by the proxy on such matter in accordance with their best judgment. If any matter not proper for action at the meeting should be presented, the holders of the proxy will vote against consideration of the matter or the proposed action.
What if I am a stockholder of record and do not provide voting instructions when returning a proxy?
Stockholders should specify their choice for each matter on the proxy card. Proxies that are signed and returned but do not contain voting instructions will be voted:
FOR the election of all director nominees as set forth in this proxy statement;
FOR the ratification of the appointment of PwC as the Company’s independent registered accounting firm for fiscal 2021;
FOR the approval, on a non-binding, advisory basis, of the compensation of our named executive officers;
77
What if I am a beneficial owner and do not give voting instructions to my broker?
If your shares are held by a broker in “street name,” your brokerage firm may vote your shares on certain “routine” matters if you do not provide voting instructions. The ratification of an independent registered public accounting firm is an example of a routine matter. If you do not provide voting instructions, your brokerage firm may either vote your shares on routine matters or leave your shares unvoted. When a brokerage firm votes its customers’ shares on a routine matter without receiving voting instructions, these shares are counted both for establishing a quorum to conduct business at the meeting and in determining the number of shares voted for or against the routine matter. A brokerage firm cannot vote your shares on non-routine matters, such as the election of Directors, and advisory vote on executive compensation. If your brokerage firm has not received voting instructions on a non-routine matter, these shares will be considered “broker non-votes” to the extent that the brokerage firm submits a proxy.
How are abstentions and broker non-votes counted?
Abstentions will be treated as present for purposes of determining a quorum but will not be included in vote totals. Abstentions will have the effect of a vote “against” each of the proposals, other than for the election of Directors whereby abstentions will not affect the outcome.
Broker non-votes are counted for purposes of establishing a quorum. Broker non-votes will have no effect on the outcome of the non-routine proposals. For the routine proposal, the ratification of an independent registered public accounting firm, discretionary voting by a broker is permitted.
Who will count the votes?
A representative from Broadridge Financial Services will tabulate the votes and act as the inspector of election for the annual meeting.
Who will bear the costs of soliciting votes for the annual meeting?
We will bear all costs of soliciting proxies. Pursuant to rules adopted by the SEC, we have elected to deliver a notice of Internet availability of proxy materials to stockholders and provide Internet access to those proxy materials. Stockholders may obtain paper copies of the proxy materials free of charge by following the instructions provided in the notice of Internet availability of proxy materials.
When will the Company announce the voting results?
The preliminary voting results will be announced at the annual meeting. The Company will report the final results on our website and in a Current Report on Form 8-K filed with the SEC.
Can I receive a copy of the Annual Report?
The annual report of the Company on Form 10-K for the year ended December 31, 20202023 is being furnished concurrently with this proxy statement to persons who were stockholders of record as of February 19, 2021,20, 2024, the record date for the annual meeting.
What is “householding” and how does it affect me?
In some cases, stockholders holding their shares in a brokerage or bank account who share the same surname and address and have not given contrary instructions are receiving only one copy of our
78
annual report on Form 10-K and this proxy statement. This reduces the volume of duplicate information received at your household and helps to reduce costs. If you would like to have additional
copies of these documents mailed to you, if you want to receive separate copies of the proxy statement, annual report to stockholders, or Notice of Internet Availability of Proxy Materials in the future, or if you are receiving multiple copies and would like to receive only one copy per household, you should contact Broadridge Householding Department, by writing Broadridge Householding Department at 51 Mercedes Way, Edgewood, NY 11717 or calling their toll free number, (866) 540-7095.
How do I submit a proposal for action at the annual of meeting of stockholders in 2022?2025?
Under applicable SEC rules and regulations, the Company will review for inclusion in next year’s proxy statement stockholder proposals received by November 10, 2021.December 17, 2024. Proposals should be sent to the Secretary of the Company at 5875 Trinity Parkway #300, Centreville,14291 Park Meadow Drive, Suite 100, Chantilly, Virginia 20120.20151.
Pursuant to our amended and restated bylaws, stockholder proposals not included in next year’s proxy statement may be brought before the 20212025 Annual Meeting of Stockholders by a stockholder of the Company who is entitled to vote at the meeting, who has given a written notice to the Secretary of the Company at 5875 Trinity Parkway #300, Centreville,14291 Park Meadow Drive, suite 100, Chantilly, Virginia 2012020151 containing certain information specified in the amended and restated bylaws and who was a stockholder of record at the time such notice was given.
Such notice must be delivered to or mailed and received at the address in the preceding paragraph no earlier than December 21, 202117, 2024 and no later than January 20, 2022,16, 2025, except that if the date of the 20222024 Annual Meeting of Stockholders is more than thirty days before or more than sixty days after the one-year anniversary of the 20212024 Annual Meeting, such notice must be delivered at the address no later than the close of business on the later of (i) the ninetieth day prior to the new date of such annual meeting and (ii) the tenth day following the day on which a public announcement of the new date of such annual meeting is first made.
In addition to satisfying the foregoing requirements under the company’s bylaws, to comply with universal proxy rules (once they become effective), stockholders who intend to solicit proxies in support of director nominees other than the Company’s nominees must provide notice that sets forth the information required by Rule 14a-19 under the Exchange Act no later than February 15, 2025.
79
APPENDIX A
RECONCILIATION OF NON-GAAP METRICS
A reconciliation of net income (loss) attributable to Parsons Corporation to adjusted EBITDA is set forth below (in thousands).
|
| December 31, |
|
| December 31, |
|
| December 31, |
| |||
Net income attributable to Parsons Corporation |
| $ | 161,149 |
|
| $ | 96,664 |
|
| $ | 64,072 |
|
Interest expense, net |
|
| 29,306 |
|
|
| 22,219 |
|
|
| 17,301 |
|
Income tax expense (benefit) |
|
| 56,138 |
|
|
| 39,657 |
|
|
| 23,636 |
|
Depreciation and amortization |
|
| 119,973 |
|
|
| 120,501 |
|
|
| 144,209 |
|
Net income attributable to noncontrolling interests |
|
| 46,766 |
|
|
| 29,901 |
|
|
| 24,880 |
|
Equity-based compensation |
|
| 36,151 |
|
|
| 24,354 |
|
|
| 19,601 |
|
Transaction-related costs (a) |
|
| 12,013 |
|
|
| 16,270 |
|
|
| 11,965 |
|
Restructuring (b) |
|
| 1,244 |
|
|
| 213 |
|
|
| 736 |
|
Other (c) |
|
| 1,933 |
|
|
| 3,003 |
|
|
| 3,320 |
|
Adjusted EBITDA |
| $ | 464,673 |
|
| $ | 352,782 |
|
| $ | 309,720 |
|
|
| December 31, 2020 |
|
| December 31, 2019 |
|
| December 31, 2018 |
| |||
Net income attributable to Parsons Corporation |
| $ | 98,541 |
|
| $ | 120,534 |
|
| $ | 222,337 |
|
Interest expense, net |
|
| 20,169 |
|
|
| 22,429 |
|
|
| 18,132 |
|
Income tax expense (benefit) |
|
| 42,492 |
|
|
| (69,886 | ) |
|
| 20,367 |
|
Depreciation and amortization |
|
| 127,980 |
|
|
| 125,700 |
|
|
| 69,869 |
|
Net income attributable to noncontrolling interests |
|
| 20,380 |
|
|
| 16,594 |
|
|
| 17,099 |
|
Litigation-related expenses (income) (a) |
|
| — |
|
|
| — |
|
|
| (129,674 | ) |
Amortization of deferred gain resulting from sale-leaseback transactions (b) |
|
| — |
|
|
| — |
|
|
| (7,253 | ) |
Equity-based compensation |
|
| 9,785 |
|
|
| 65,744 |
|
|
| 16,487 |
|
Transaction-related costs (c) |
|
| 19,922 |
|
|
| 34,353 |
|
|
| 12,942 |
|
Restructuring (d) |
|
| 2,193 |
|
|
| 3,424 |
|
|
| — |
|
Other (e) |
|
| 1,159 |
|
|
| 6,155 |
|
|
| 5,938 |
|
Adjusted EBITDA |
| $ | 342,621 |
|
| $ | 325,047 |
|
| $ | 246,244 |
|
|
|
|
|
|
|
|
|
|
|
Adjusted EBITDA is a supplemental measure of our operating performance included in the Annual Report on Form 10-K because it is used by management and our Board of Directors to assess our financial performance both on a segment and on a consolidated basis. We discuss adjusted EBITDA because our management uses this measure for business planning purposes, including to manage the business against internal projected results of operations and to measure the performance of the business generally. Adjusted EBITDA is frequently used by analysts, investors and other interested parties to evaluate companies in our industry.
Adjusted EBITDA is not a U.S. GAAP measure of our financial performance or liquidity and should not be considered as an alternative to net income as a measure of financial performance or cash flows from operations as measures of liquidity, or any other performance measure derived in accordance with U.S. GAAP. We define adjusted EBITDA as net income attributable to Parsons Corporation, adjusted to include net income attributable to noncontrolling interests and to exclude interest expense (net of interest income), provision for income taxes, depreciation and amortization and certain other items that we do not consider in our evaluation of ongoing operating performance. These other items include, among other things, impairment of goodwill, intangible and other assets, interest and other expenses recognized on litigation matters, amortization of deferred gain resulting from sale-leaseback transactions, expenses incurred in connection with acquisitions and other non-recurring transaction costs, equity-based compensation, and expenses related to our corporate restructuring initiatives. Adjusted EBITDA should not be construed as an inference that our future
results will be unaffected by unusual or non-recurring items. Additionally, adjusted EBITDA is not intended to be a measure of free cash flow for management’s discretionary use, as it does not reflect tax payments, debt service requirements, capital expenditures and certain other cash costs that may recur in the future, including, among other things, cash requirements for working capital needs and cash costs to replace assets being depreciated and amortized. Management compensates for these limitations by relying on our U.S. GAAP results in addition to using adjusted EBITDA supplementally. Our measure
A-1
of adjusted EBITDA is not necessarily comparable to similarly titled captions of other companies due to different methods of calculation.
The following table shows adjusted EBITDA attributable to Parsons Corporation for each of our reportable segments and adjusted EBITDA attributable to noncontrolling interests:
|
| Fiscal Year Ended |
|
| Fiscal Year Ended |
| ||||||||||||||||||
(U.S. dollars in thousands) |
| December 31, 2020 |
|
| December 31, 2019 |
|
| December 31, 2018 |
|
| December 31, |
|
| December 31, |
|
| December 31, |
| ||||||
Federal Solutions adjusted EBITDA attributable to Parsons Corporation |
| $ | 167,340 |
|
| $ | 169,100 |
|
| $ | 121,986 |
|
| $ | 289,250 |
|
| $ | 199,004 |
|
| $ | 162,733 |
|
Critical Infrastructure adjusted EBITDA attributable to Parsons Corporation |
|
| 154,528 |
|
|
| 138,851 |
|
|
| 106,851 |
|
|
| 127,785 |
|
|
| 123,385 |
|
|
| 121,700 |
|
Adjusted EBITDA attributable to noncontrolling interests |
|
| 20,753 |
|
|
| 17,096 |
|
|
| 17,407 |
|
|
| 47,638 |
|
|
| 30,393 |
|
|
| 25,287 |
|
Total adjusted EBITDA |
| $ | 342,621 |
|
| $ | 325,047 |
|
| $ | 246,244 |
|
| $ | 464,673 |
|
| $ | 352,782 |
|
| $ | 309,720 |
|
See “Management’s Discussion and Analysis of Financial Condition and Results of Operations—Segment Results,” and “Note 21—20—Segments Information” in the notes to our consolidated financial statements included elsewhere in the Company’s Annual Report on Form 10-K filed with the U.S. Securities and Exchange Commission on February 14, 2024 for a further discussion regarding our segment adjusted EBITDA attributable to Parsons Corporation.
A-2 |
|
|
|

Your Vote Counts! PARSONS CORPORATION 2024 Annual Meeting Vote by April 15, 2024 11:59 PM ET. For shares held in ESOP, vote by April 11, 2024 11:59 PM ET. PARSONS PARSONS CORPORATION 5875 TRINITY PARKWAY,14291 PARK MEADOW DRIVE, SUITE 300 CENTREVILLE,100 CHANTILLY, VA 20120 VOTE BY INTERNET Before The Meeting - Go20151 V28203-P02672 You invested in PARSONS CORPORATION and it’s time to www.proxyvote.com Usevote! You have the Internetright to transmit your voting instructions andvote on proposals being presented at the Annual Meeting. This is an important notice regarding the availability of proxy material for electronic delivery of information. Vote by 11:59 p.m. Eastern Timethe shareholder meeting to be held on April 19, 2021 for shares held directly and by 11:59 p.m. Eastern Time on April 15, 2021 for shares held in a Plan. Have your proxy card in hand when you access the web site and follow the instructions to obtain your records and to create an electronic voting instruction form. During The Meeting - Go to www.virtualshareholdermeeting.com/PSN2021 You may attend the meeting via the Internet and vote during the meeting. Have the information that is printed in the box marked by the arrow available and follow the instructions. VOTE BY PHONE - 1-800-690-6903 Use any touch-tone telephone to transmit your voting instructions. Vote by 11:59 p.m. Eastern Time on April 19, 2021 for shares held directly and by 11:59 p.m. Eastern Time on April 15, 2021 for shares held in a Plan. Have your proxy card in hand when you call and then follow the instructions. VOTE BY MAIL Mark, sign and date your proxy card and return it in the postage-paid envelope we have provided or return it to Vote Processing, c/o Broadridge, 51 Mercedes Way, Edgewood, NY 11717. TO VOTE, MARK BLOCKS BELOW IN BLUE OR BLACK INK AS FOLLOWS: D29800-P48512 KEEP THIS PORTION FOR YOUR RECORDS THIS PROXY CARD IS VALID ONLY WHEN SIGNED AND DATED. PARSONS CORPORATION For All Withhold All For All Except To withhold authority to vote for any individual nominee(s), mark "For All Except" and write the number(s) of the nominee(s) on the line below. 1. Election of Directors Nominees: 01) Mark K. Holdsworth 02) Steven F. Leer 03) M. Christian Mitchell 04) David C. Wajsgras The Board of Directors recommends16, 2024. Get informed before you vote "FOR" proposals 2 and 3. For Against Abstain 2. Ratification of appointment of PricewaterhouseCoopers LLP asView the Company's independent registered accounting firm for fiscal year 2021.3. To approve, by non-binding advisory vote, the compensation program for the Company's named executive officers, as disclosed in the Compensation Discussion and Analysis of the proxy statement. NOTE: The shares represented by this proxy when properly executed will be voted in the manner directed herein by the undersigned Stockholder(s). If no direction is made, this proxy will be voted FOR items 1, 2 and 3. If any other matters properly come before the meeting or if cumulative voting is required, the person named in this proxy will vote in their discretion. Please sign exactly as your name(s) appear(s) hereon. When signing as attorney, executor, administrator, or other fiduciary, please give full title as such. Joint owners should each sign personally. All holders must sign. If a corporation or partnership, please sign in full corporate or partnership name by authorized officer. Signature [PLEASE SIGN WITHIN BOX] Date Signature (Joint Owners) Date

Important Notice Regarding the Availability of Proxy Materials for the Annual Meeting: The Notice and Proxy Statement and Form 10-K Wrap are available at www.proxyvote.com. D29801-P48512 PARSONS CORPORATION Annual Meetingonline OR you can receive a free paper or email copy of Stockholdersthe material(s) by requesting prior to April 20, 2021 This proxy is solicited by2, 2024. If you would like to request a copy of the Board of Directors The undersigned hereby appoints Charles L. Harrington and Michael R. Kolloway, material(s) for this and/or either of them, as proxies, each withfuture shareholder meetings, you may (1) visit www.ProxyVote.com, (2) call 1-800-579-1639 or (3) send an email to sendmaterial@proxyvote.com. If sending an email, please include your control number (indicated below) in the power to appoint to substitute each, and hereby authorizes them to representsubject line. Unless requested, you will not otherwise receive a paper or email copy. For complete information and to vote, as designated on the reverse side of the this ballot, all of the shares of Common Stock of Parsons Corporation that the stockholders are entitled tovisit www.ProxyVote.com Control # Smartphone users Point your camera here and vote without entering a control number Vote Virtually at the Annual Meeting of Stockholders to be held atMeeting* April 16, 2024 9:00 a.m., Eastern Time on April 20, 2021, virtually atVirtually at: www.virtualshareholdermeeting.com/PSN2021, andPSN2024 *Please check the meeting materials for any adjournment or postponement thereof. THIS PROXY, WHEN PROPERLY EXECUTED, WILL BE VOTED AS DIRECTED BY THE UNDERSIGNED. IF NO SUCH DIRECTIONS ARE MADE, THIS PROXY WILL BE VOTED FOR THE ELECTION OF THE NOMINEES LISTED ON THE REVERSE SIDE FOR THE BOARD OF DIRECTORS AND FOR PROPOSALS 2 AND 3. PLEASE MARK, SIGN, DATE AND RETURN THIS PROXY CARD PROMPTLY USING THE ENCLOSED REPLY ENVELOPE. Continued and to be signed on reverse sidespecial requirements for meeting attendance V1.1